Grade 12 Maths · Paper 2
Statistics Grade 12
Real past paper questions and answers from 2024 to 2025, with each memo split into the ticks examiners give. Try one, mark yourself, and see exactly which skill cost you marks.
- past paper questions
- 3 past paper questions
- skills
- 7 skills
- videos
- 7 videos
Try a real exam question
No sign-up. Takes 3 minutes.
Question 2.1 · May/June 2025 · Paper 2 · National (DBE) · 3 marks
The supermarket received online orders on a certain day. The information for these orders is shown below.
Number of items (x): 10, 3, 20, 14, 17, 9, 12, 18, 15, 19
Time (in minutes) (y): 5, 5, 9, 7, 6, 6, 8, 11, 10, 12
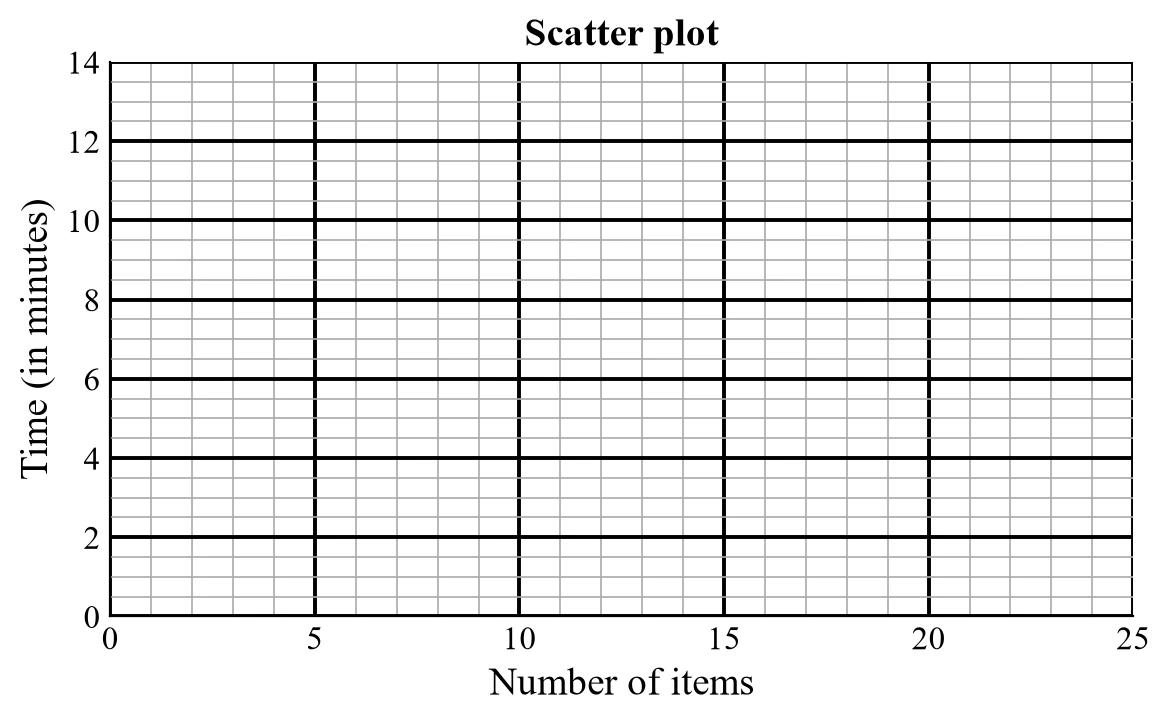
Work it out on paper first. Then mark yourself with the official memo, one tick at a time.
What's in Statistics Grade 12
Each skill is one thing a memo gives a tick for. Tap a skill for its own questions, notes and videos.
Scatter Plots3 past paper questions
- Plot and read pointsRead the coordinates of a point on a graph, or plot a given point in the right place (for example the point (3; −2) is 3 right and 2 down).2 past paper questions · 2 videos
- Draw a straight-line graphDraw a straight-line graph from its equation using intercepts or slope (for example y = 2x + 1 cuts the y-axis at 1).3 past paper questions · 3 videos
- Describe skewness and outliersSay whether data is symmetric, skewed left or skewed right, and spot outliers, for example when the mean is much bigger than the median.1 past paper question · 3 videos
- Find the regression lineUse a calculator to find the line of best fit for paired data and write it as y = a + bx, for example y = 3,2 + 1,5x.1 past paper question · 4 videos
- Find and describe the correlationFind the correlation coefficient r on a calculator and describe the link between two variables, for example r = 0,92 is strong and positive.1 past paper question · 4 videos
- Predict with the regression lineUse a line of best fit to predict a value, for example estimate a test mark from hours studied, and explain what the gradient means.2 past paper questions · 3 videos
- Choose the best-fitting curveLook at a scatter plot and decide whether a straight line, a parabola or an exponential curve fits the points best, and say why.3 videos
Statistics Grade 12 videos
Short lessons from South African teachers first. Videos load only when you tap play, to save your data.
Free on Android
Know exactly which skill is costing you marks.
Mark past papers tick by tick in the NavyBlue app. It remembers every mark you lose, shows you the skills to fix first, and picks your next questions.
Get NavyBlue free on Google Play
