Grade 10 Maths · Paper 2
Statistics Grade 10
Real past paper questions and answers from 2024 to 2024, with each memo split into the ticks examiners give. Try one, mark yourself, and see exactly which skill cost you marks.
- past paper questions
- 20 past paper questions
- skills
- 12 skills
- videos
- 12 videos
Try a real exam question
No sign-up. Takes 3 minutes.
Question 4.5 · September 2024 · Provincial · 3 marks
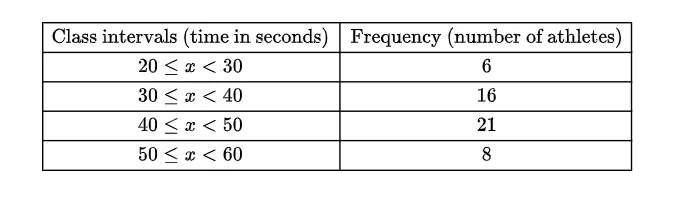
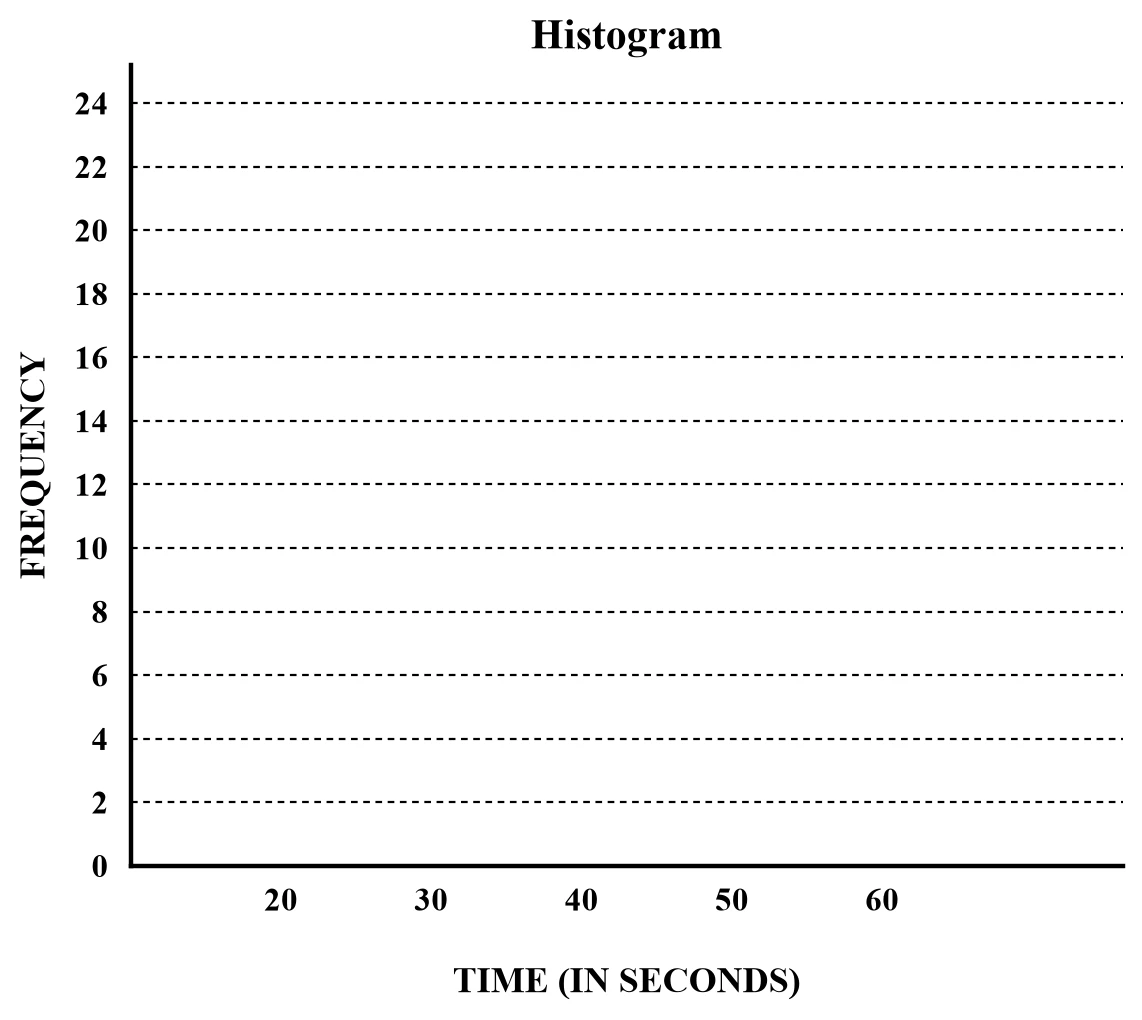
Work it out on paper first. Then mark yourself with the official memo, one tick at a time.
What's in Statistics Grade 10
Each skill is one thing a memo gives a tick for. Tap a skill for its own questions, notes and videos.
Representation of Data5 past paper questions
- Read and complete a frequency tableRead and fill in a frequency table, for example find a missing count or how many learners scored below 50.3 past paper questions · 3 videos
- Draw a histogram, polygon or ogiveDraw a histogram, frequency polygon or ogive from a frequency table, with correct scales, labels and heights.1 past paper question · 3 videos
- Use bar, pie and line graphsDraw and read bar graphs, pie charts and line graphs, for example a pie chart slice for 25% is 90°.3 videos
Measures of Central Tendency6 past paper questions
- Find the medianPut the data in order and find the middle value (for example the median of 2, 5, 7, 9 is 6, the mean of 5 and 7).1 past paper question · 3 videos
- Calculate the meanFind the average by adding all the values and dividing by how many there are (for example (4 + 6 + 8) ÷ 3 = 6).4 past paper questions · 3 videos
- Find the mode or modal classFind the value that appears most often, or the group with the highest frequency, for example the mode of 2, 3, 3, 5 is 3.2 past paper questions · 3 videos
- Interpret data and draw conclusionsExplain what data shows in real life, for example compare two classes' results or say whether a graph is misleading.4 videos
- Estimate the mean of grouped dataEstimate the mean of grouped data by multiplying each class midpoint by its frequency, adding, and dividing by the total frequency.2 past paper questions · 4 videos
- Find the median or quartile intervalFind which class interval holds the median or a quartile in grouped data, for example the 20th value of 40 lies in 30 ≤ x < 40.3 past paper questions · 3 videos
Measures of Dispersion7 past paper questions
- Interpret data and draw conclusionsExplain what data shows in real life, for example compare two classes' results or say whether a graph is misleading.4 videos
- Find quartiles, range and IQRFind the quartiles, range and interquartile range of ordered data, for example in 2, 4, 6, 8, 10, 12, 14 the IQR is 12 − 4 = 8.5 past paper questions · 3 videos
- Find the median or quartile intervalFind which class interval holds the median or a quartile in grouped data, for example the 20th value of 40 lies in 30 ≤ x < 40.3 past paper questions · 3 videos
The Five Number Summary2 past paper questions
- Find quartiles, range and IQRFind the quartiles, range and interquartile range of ordered data, for example in 2, 4, 6, 8, 10, 12, 14 the IQR is 12 − 4 = 8.5 past paper questions · 3 videos
- Draw a box and whisker diagramDraw a box and whisker diagram from the minimum, quartiles, median and maximum on a number line, and read values from one.1 past paper question · 3 videos
- Describe skewness and outliersSay whether data is symmetric, skewed left or skewed right, and spot outliers, for example when the mean is much bigger than the median.1 past paper question · 3 videos
More Statistics Grade 10 questions and answers
Try each one on paper before you open the memo.
1. Question 5.2.1 · September 2024 · Provincial · 2 marks
The following Life Sciences marks, for a test out of 50, were recorded from 15 grade 10 learners at a certain school. 5.2 Determine:5.2.1 The mean of the data.(2)
Show the memo (2 ticks)Memo
- ✓
1 mark · Calculate the mean
- ✓Answer
1 mark · Calculate the mean
- ✓
Statistics Grade 10 videos
Short lessons from South African teachers first. Videos load only when you tap play, to save your data.
Free on Android
Know exactly which skill is costing you marks.
Mark past papers tick by tick in the NavyBlue app. It remembers every mark you lose, shows you the skills to fix first, and picks your next questions.
Get NavyBlue free on Google Play
