Grade 10 Maths · Statistics
Estimate the mean of grouped data
Estimate the mean of grouped data by multiplying each class midpoint by its frequency, adding, and dividing by the total frequency.
- past paper questions use it
- 4 past paper questions use it
- videos
- 4 videos
Learn it: estimate the mean of grouped data
Pick one and watch it, then try the questions below. Videos load only when you tap play.
Now try it on a real exam question
No sign-up. Takes 3 minutes.
Question 4.2 · September 2024 · Provincial · 4 marks
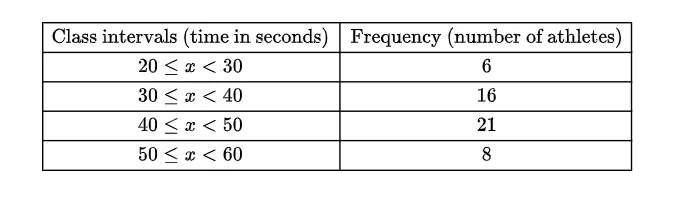
Work it out on paper first. Then mark yourself with the official memo, one tick at a time.
More past paper questions: estimate the mean of grouped data
Work each one out first, then open the memo and check every tick.
3. Question 2.3 · November 2024 · Paper 2 · Provincial · 4 marks
The histogram below shows the distribution of examination scores for learners in Introductory stats.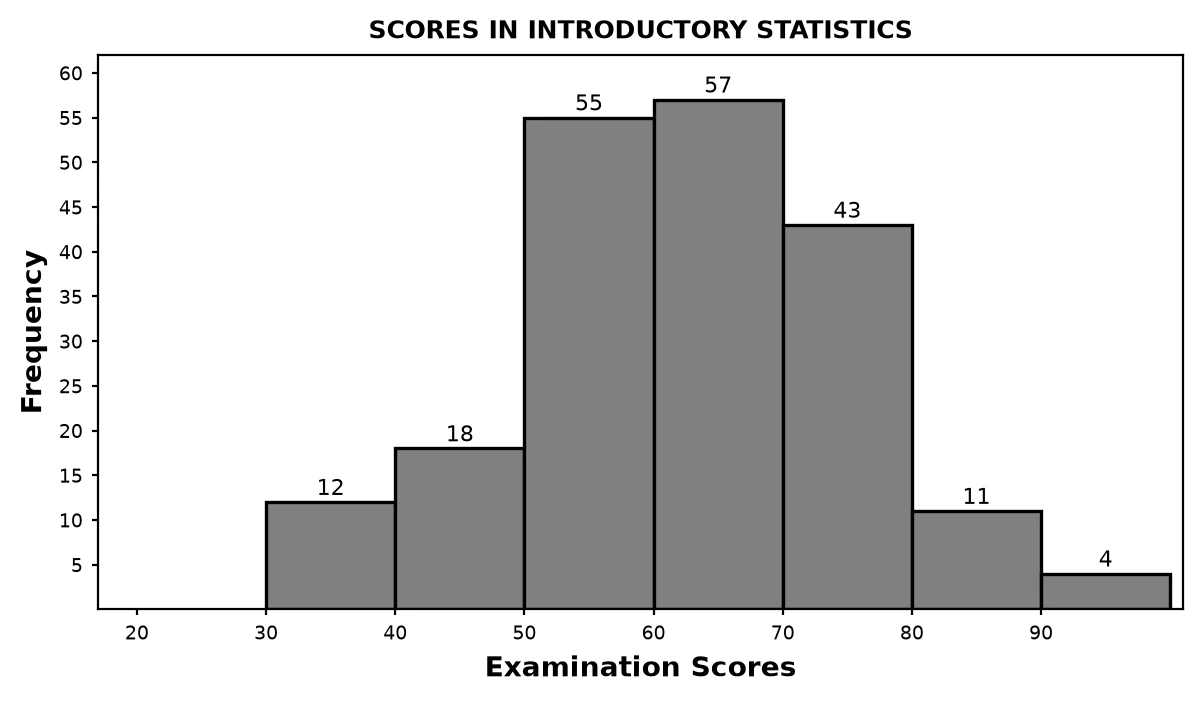 2.3 Estimate the mean of this data. Show all calculations.(4)
Show the memo (4 ticks)Memo
- ✓Add the frequencies
1 mark · Estimate the mean of grouped data
- ✓Sum of midpoint × frequencyMidpoints |
1 mark · Estimate the mean of grouped data
- ✓Substitution
1 mark · Estimate the mean of grouped data
- ✓Answer
1 mark · Estimate the mean of grouped data
- ✓
4. Question a · Siyavula Grade 10 Mathematics, 10.4 Measures of dispersion, Worked example 13 · 3 marks
The mathematics marks of grade learners at a school have been collected. The data are presented in the following table: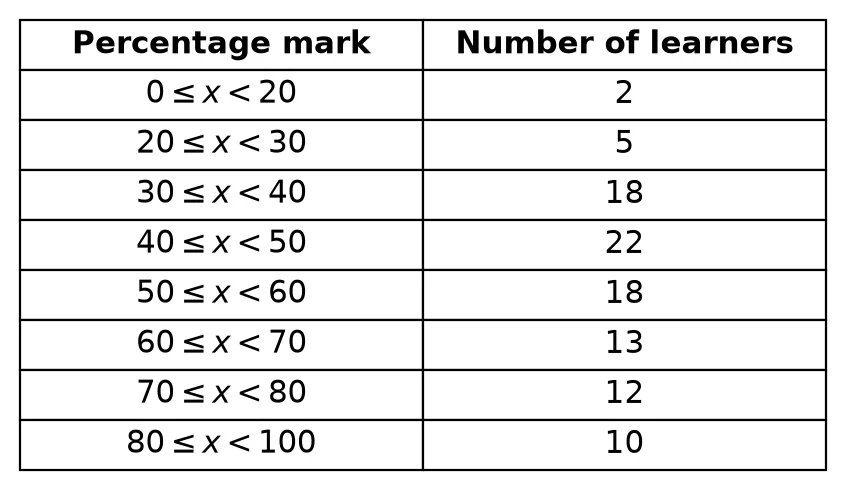 a Calculate the mean of this grouped data set.(3)
Show the memo (3 ticks)Memo
- ✓MidpointsAssume all the learners in each interval are at the central value of the interval:
1 mark · Estimate the mean of grouped data
- ✓Sum of frequency times midpoint over totalMean
1 mark · Estimate the mean of grouped data
- ✓Answer
1 mark · Estimate the mean of grouped data
- ✓
Free on Android
Know exactly which skill is costing you marks.
Mark past papers tick by tick in the NavyBlue app. It remembers every mark you lose, shows you the skills to fix first, and picks your next questions.
Get NavyBlue free on Google Play
