Grade 10 Maths · Statistics
Draw a histogram, polygon or ogive
Draw a histogram, frequency polygon or ogive from a frequency table, with correct scales, labels and heights.
- past paper questions use it
- 6 past paper questions use it
- videos
- 3 videos
Learn it: draw a histogram, polygon or ogive
Pick one and watch it, then try the questions below. Videos load only when you tap play.
Now try it on a real exam question
No sign-up. Takes 3 minutes.
Question 4.5 · September 2024 · Provincial · 3 marks
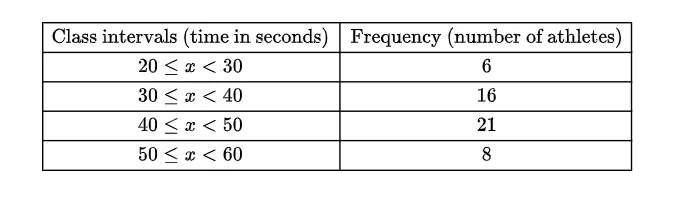
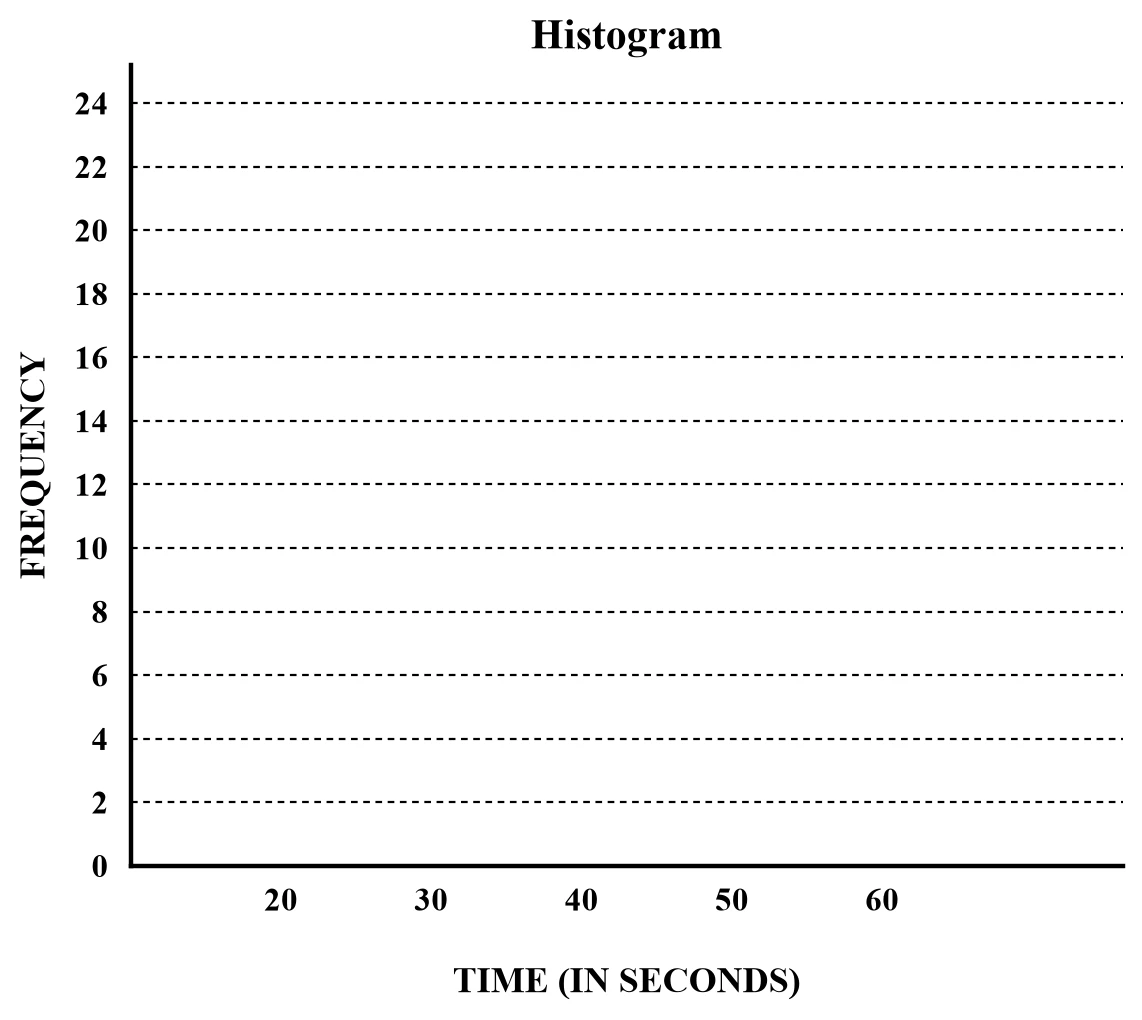
Work it out on paper first. Then mark yourself with the official memo, one tick at a time.
More past paper questions: draw a histogram, polygon or ogive
Work each one out first, then open the memo and check every tick.
3. Question WE9 · Siyavula Grade 10 Mathematics, 10.3 Grouping data, Worked example 9 · 3 marks
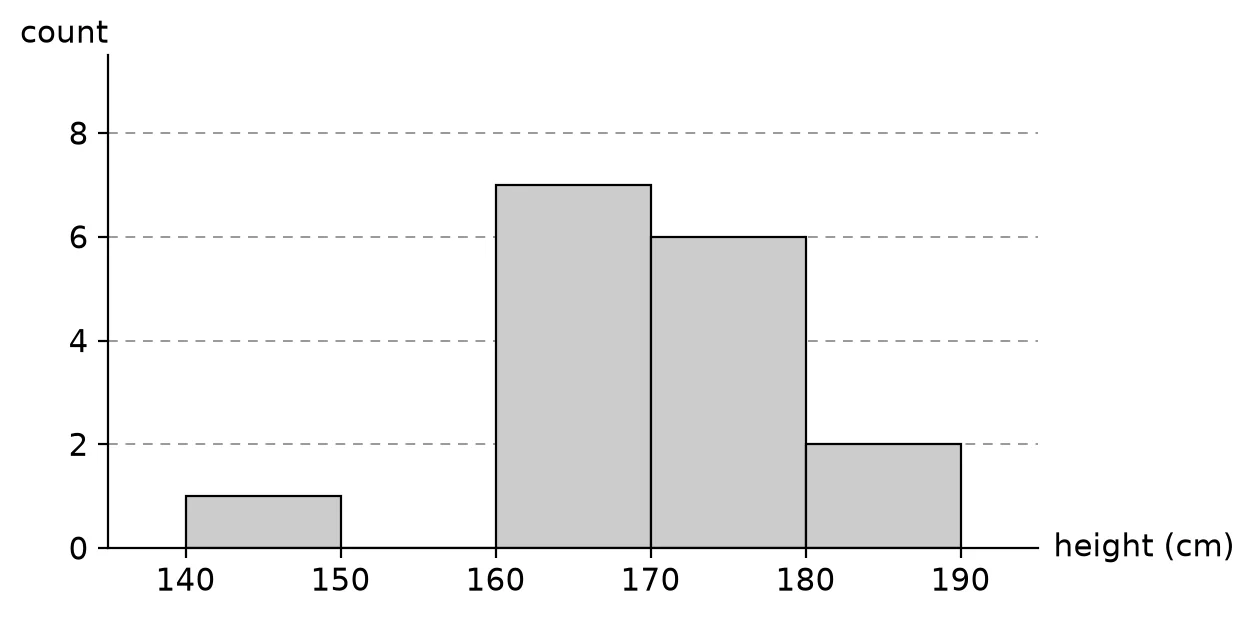
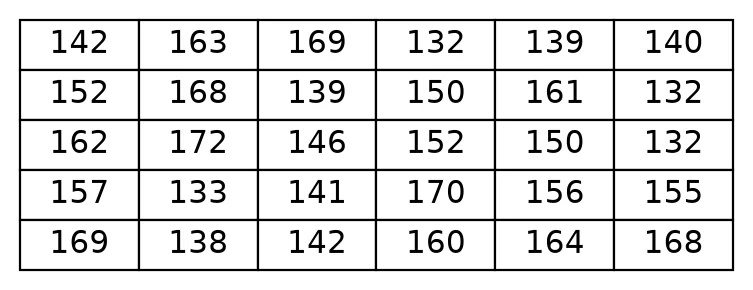 WE9 The heights in centimetres of learners are given below.
Group the data into the following ranges and draw a histogram of the grouped data:
(Note that the ranges do not overlap since each one starts where the previous one ended.)(3)Show the memo (3 ticks)Memo
- ✓Count the values in each range:
:
:
:
:1 mark · Read and complete a frequency table
- ✓Bars on the rangesThere are ranges, so the histogram has rectangles. The base of each rectangle is its range on the height axis: to , to , and so on, with no gaps between them.
1 mark · Draw a histogram, polygon or ogive
- ✓Heights of the barsThe height of each rectangle is the count in its range: , , , and (see the histogram).
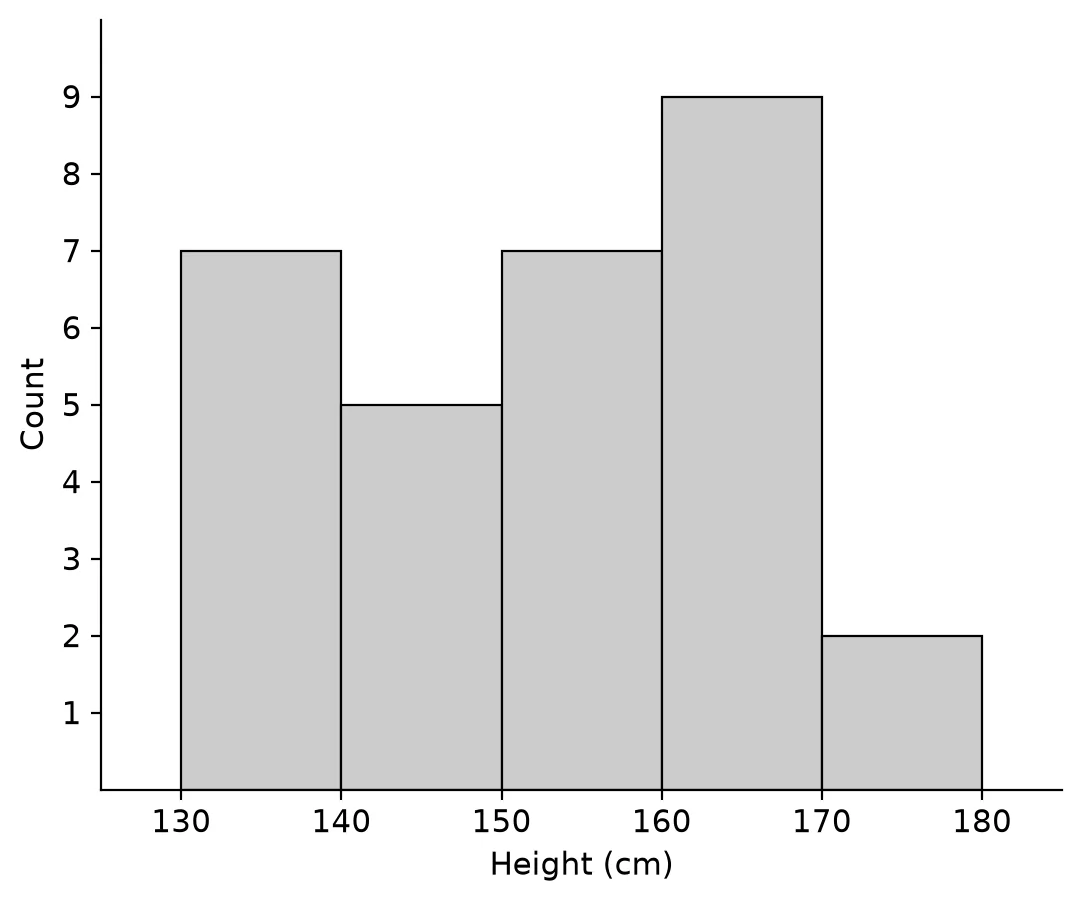
1 mark · Draw a histogram, polygon or ogive
- ✓
4. Question WE5 · Siyavula Grade 11 Mathematics, 11.2 Histograms, Worked example 5 · 4 marks
WE5 The following data represent the heights of adults in centimetres.
Divide the data into equal length intervals between and and draw a histogram.(4)Show the memo (4 ticks)Memo
- ✓IntervalsTo have intervals of the same length between and , we need an interval length of .
The intervals are ; ; ; and .1 mark · Read and complete a frequency table
- ✓Counts: ; : ; : ; : ; :
1 mark · Read and complete a frequency table
- ✓Bars on the intervalsDraw one rectangle on each interval of the height axis, from to , with no gaps between the intervals.
1 mark · Draw a histogram, polygon or ogive
- ✓Heights of the barsThe heights of the rectangles are the counts: , , , and (see the histogram).
1 mark · Draw a histogram, polygon or ogive
- ✓
5. Question a · Siyavula Grade 11 Mathematics, 11.2 Histograms, Worked example 7 · 2 marks
In the previous worked example, the heights of adults were grouped into intervals of length and drawn as the frequency polygon below.
Here is another data set of heights, this time of Grade learners.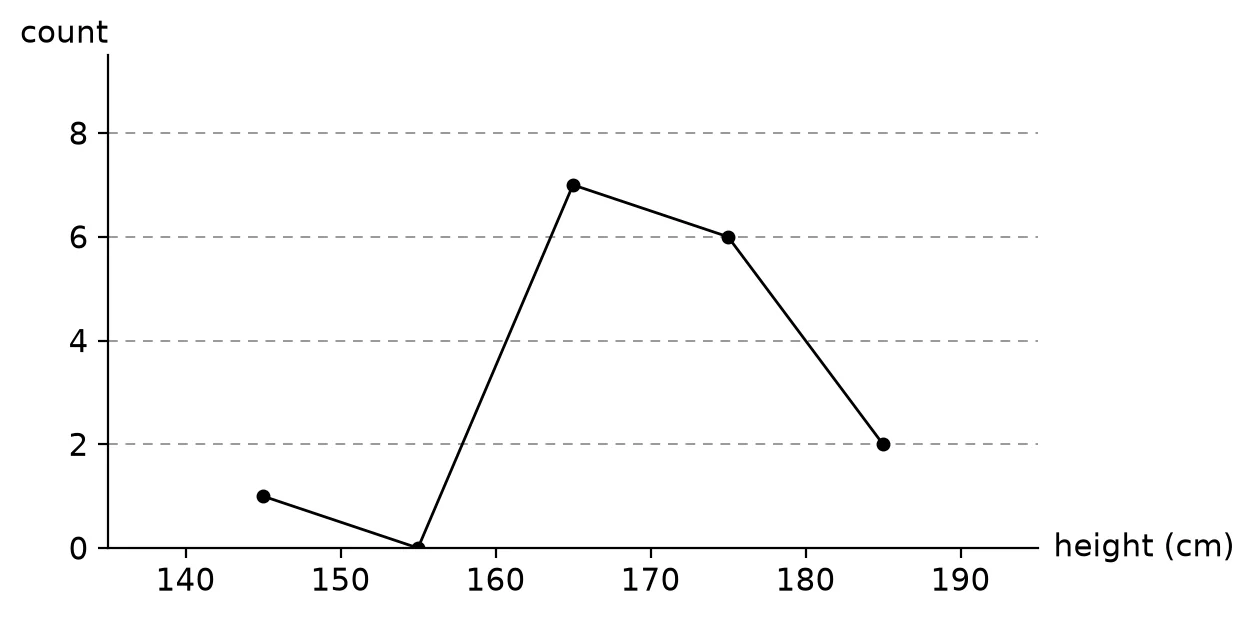 a Draw the frequency polygon for this data set using the same interval length as in the previous example.(2)
Show the memo (2 ticks)Memo
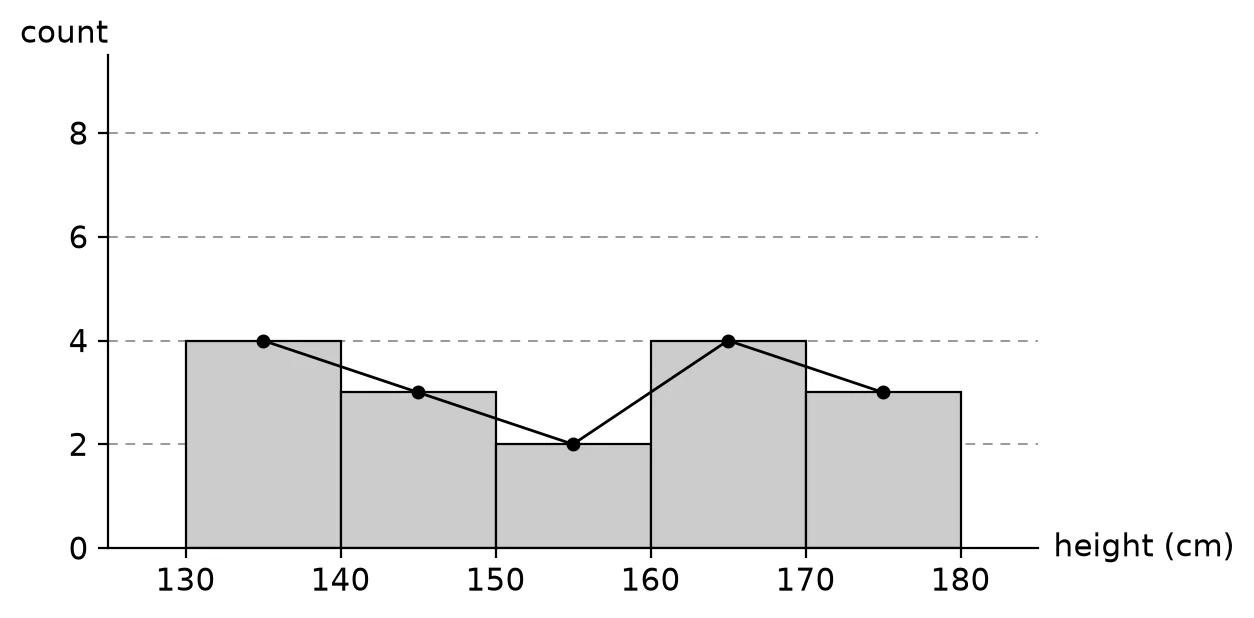
- ✓Frequency table: ; : ; : ; : ; :
1 mark · Read and complete a frequency table
- ✓Frequency polygonPlot the counts above the midpoints of the intervals, , , , and , and join them with line segments.
1 mark · Draw a histogram, polygon or ogive
- ✓
Free on Android
Know exactly which skill is costing you marks.
Mark past papers tick by tick in the NavyBlue app. It remembers every mark you lose, shows you the skills to fix first, and picks your next questions.
Get NavyBlue free on Google Play
