Grade 10 Maths · Functions
Plot and read points
Read the coordinates of a point on a graph, or plot a given point in the right place (for example the point (3; −2) is 3 right and 2 down).
- past paper questions use it
- 12 past paper questions use it
- videos
- 2 videos
Learn it: plot and read points
Pick one and watch it, then try the questions below. Videos load only when you tap play.
Now try it on a real exam question
No sign-up. Takes 3 minutes.
Question 2.1 · May/June 2025 · Paper 2 · National (DBE) · 3 marks
The supermarket received online orders on a certain day. The information for these orders is shown below.
Number of items (x): 10, 3, 20, 14, 17, 9, 12, 18, 15, 19
Time (in minutes) (y): 5, 5, 9, 7, 6, 6, 8, 11, 10, 12
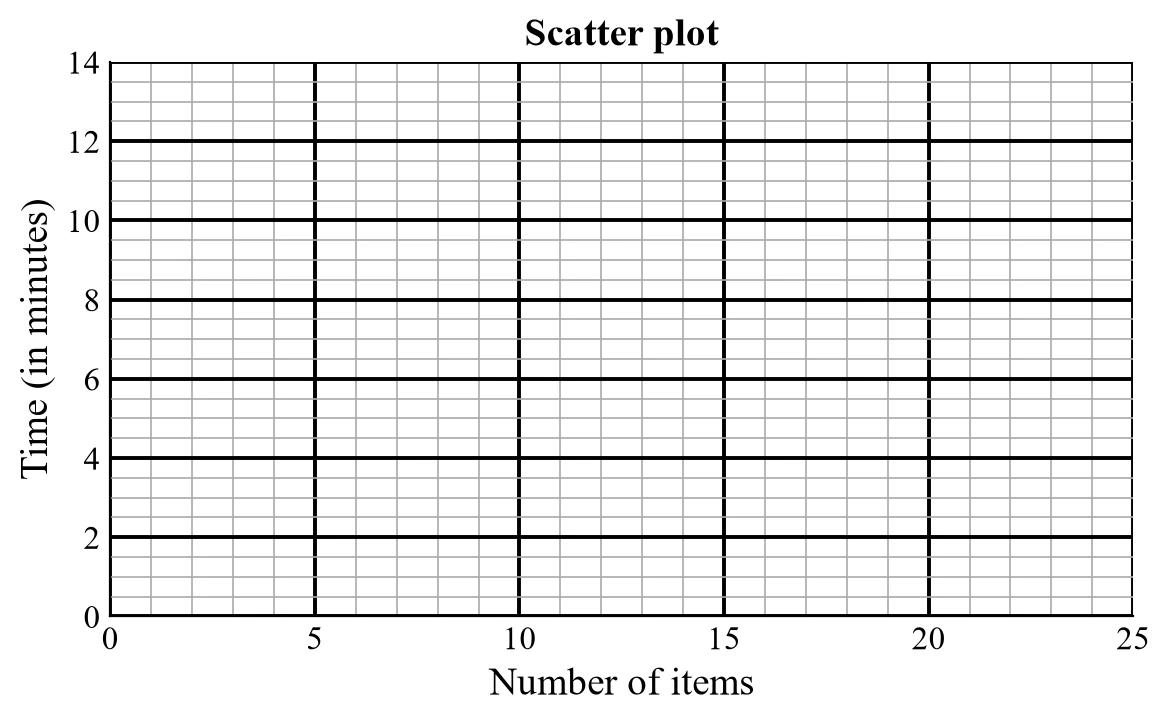
Work it out on paper first. Then mark yourself with the official memo, one tick at a time.
More past paper questions: plot and read points
Work each one out first, then open the memo and check every tick.
3. Question WE23.4 · Siyavula Grade 8 Mathematics, 23 Graphs, The Cartesian plane, Worked example 23.4 · 2 marks
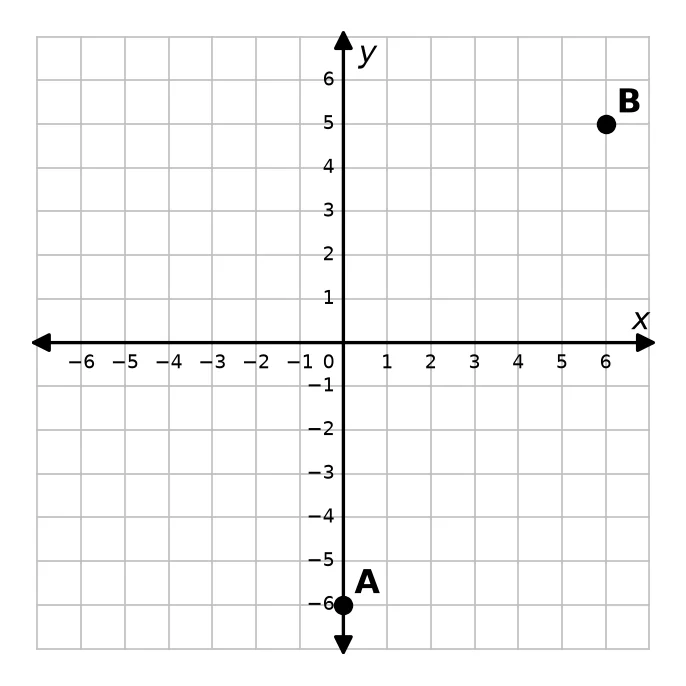 WE23.4 The diagram shows the Cartesian plane and two points. The points are labelled and . Write down the coordinates of and .(2)
Show the memo (2 ticks)Memo
- ✓Coordinates of B is units to the right of the origin and units above it.
1 mark · Plot and read points
- ✓Coordinates of A lies on the -axis, so its -coordinate is . It is units below the origin.
1 mark · Plot and read points
- ✓
4. Question b · Siyavula Grade 8 Mathematics, 23 Graphs, Drawing global graphs, Worked example 23.2 · 2 marks
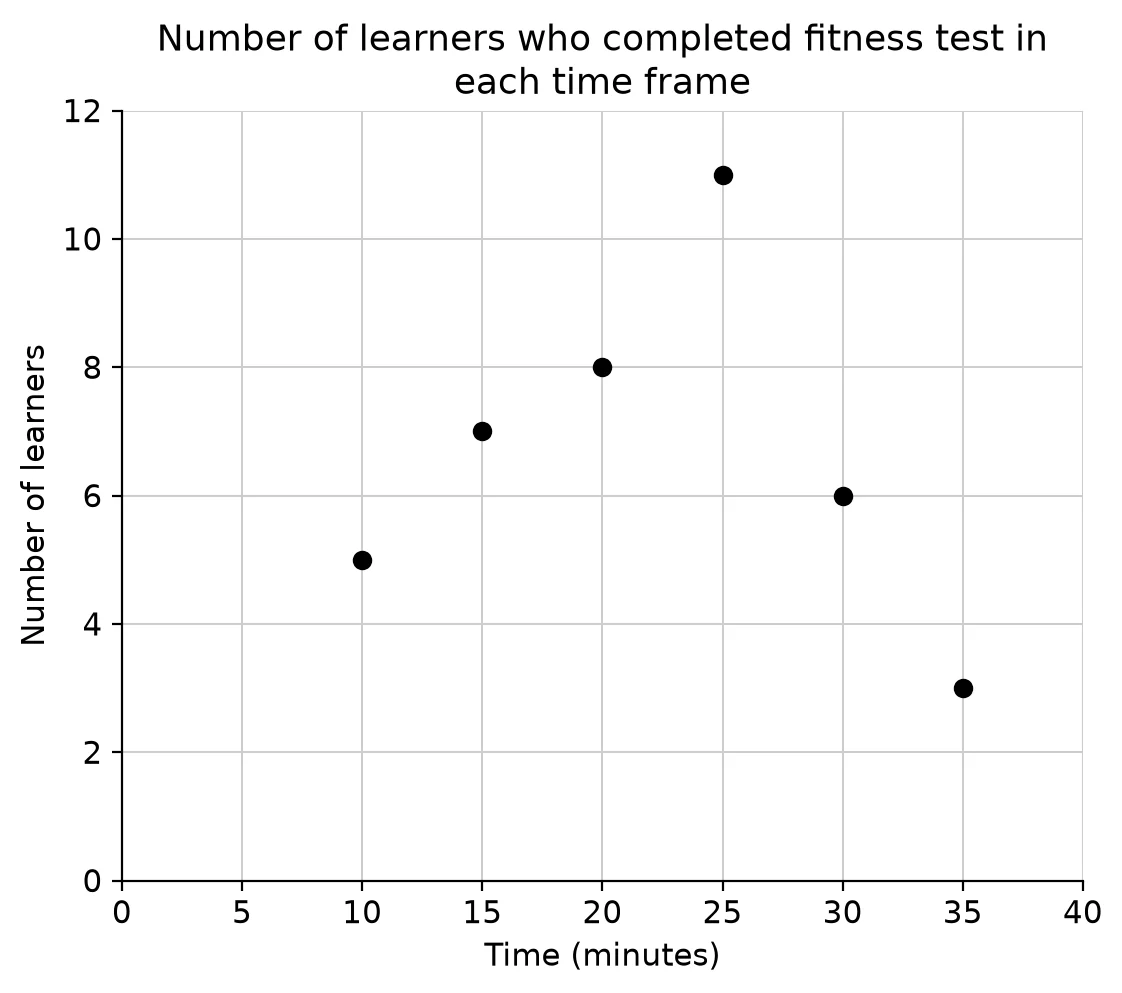
Forty learners completed a physical fitness test consisting of different exercises. learners completed the test in minutes, learners completed the test in minutes, learners completed the test in minutes, learners completed the test in minutes, learners completed the test in minutes and learners completed the test in minutes.
Use the information provided to answer the questions.b Use the information provided to draw a suitable graph.(2)Show the memo (2 ticks)Memo
- ✓Plot the pointsPlot the points , , , , and with time (minutes) on the horizontal axis and number of learners on the vertical axis.
1 mark · Plot and read points
- ✓Points not joinedThe data is discrete, so the points are not joined by a line (see the graph).
1 mark · Interpret or draw a global graph
- ✓
5. Question 5.4 · November 2025 · Paper 2 · Provincial · 1 mark
Given: and ,
The graphs of and are drawn below.
Use the graphs to answer the following questions where :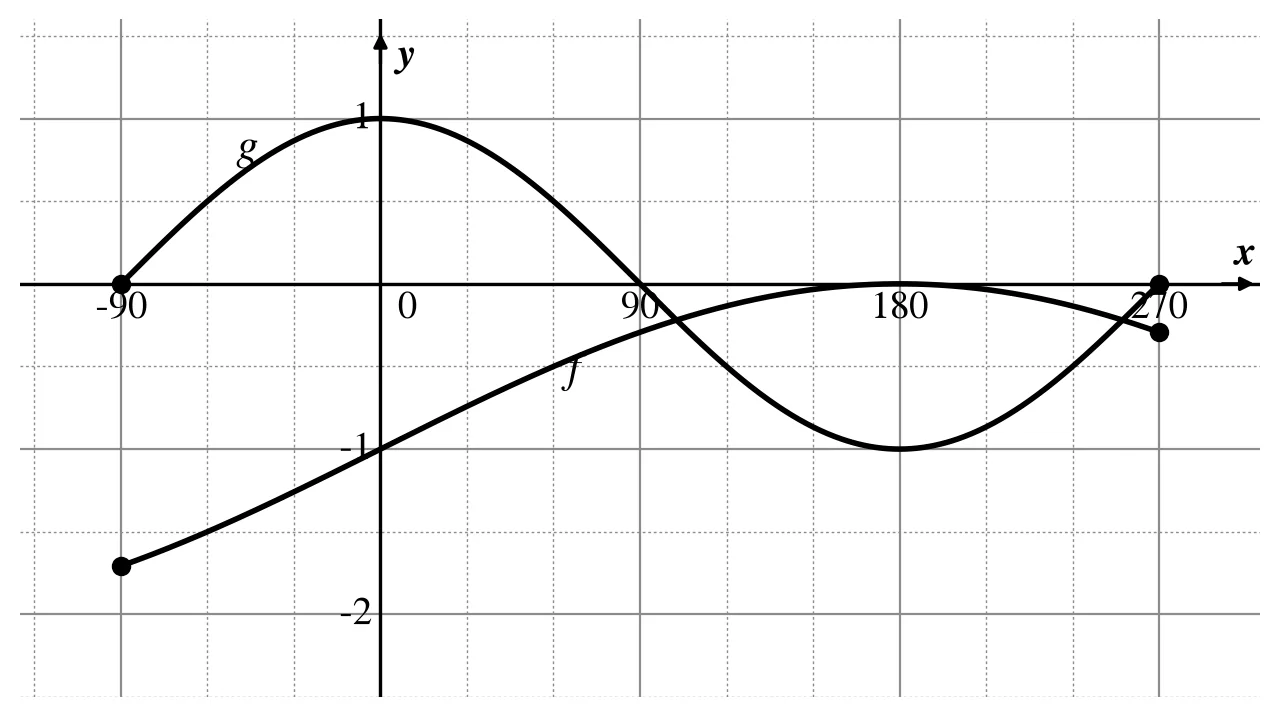 5.4 Write down the value(s) of where (1)
Show the memo (1 tick)Memo
- ✓Answer
1 mark · Plot and read points
- ✓
6. Question 6.5.1 · November 2024 · Paper 2 · Provincial · 1 mark
The graph of in the interval of has been drawn in the diagram below.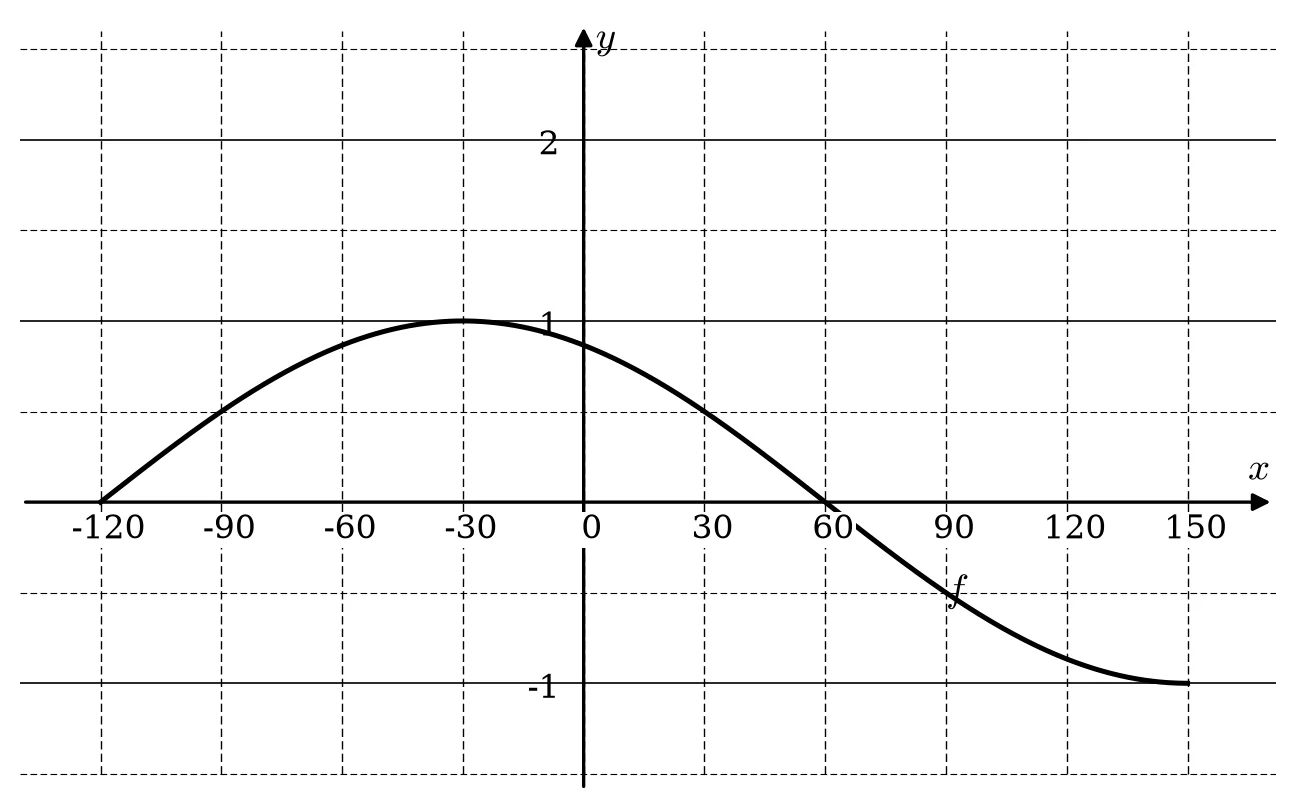 6.5 Use the graph to answer the following questions in the interval .
For which values of is:6.5.1 having a minimum value?(1)Show the memo (1 tick)Memo
- ✓Answer
1 mark · Plot and read points
- ✓
Free on Android
Know exactly which skill is costing you marks.
Mark past papers tick by tick in the NavyBlue app. It remembers every mark you lose, shows you the skills to fix first, and picks your next questions.
Get NavyBlue free on Google Play
