Grade 10 Maths · Statistics
Interpret data and draw conclusions
Explain what data shows in real life, for example compare two classes' results or say whether a graph is misleading.
- past paper questions use it
- 4 past paper questions use it
- videos
- 4 videos
Learn it: interpret data and draw conclusions
Pick one and watch it, then try the questions below. Videos load only when you tap play.
Now try it on a real exam question
No sign-up. Takes 3 minutes.
Question b · Siyavula Grade 11 Mathematics, 11.2 Histograms, Worked example 7 · 3 marks
Here is another data set of heights, this time of Grade learners.
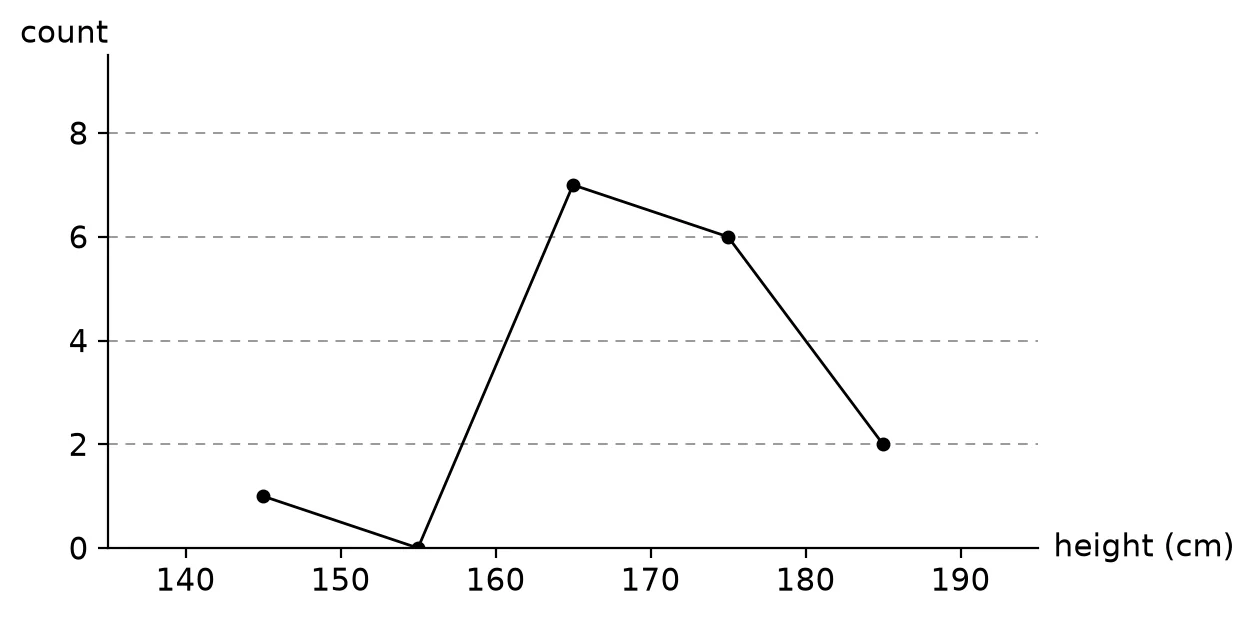
Work it out on paper first. Then mark yourself with the official memo, one tick at a time.
More past paper questions: interpret data and draw conclusions
Work each one out first, then open the memo and check every tick.
3. Question WE8 · Siyavula Grade 10 Mathematics, 10.2 Measures of central tendency, Worked example 8 · 6 marks
WE8 The heights of learners are measured in centimetres to obtain the following data set:
Afterwards, we include one more learner in the group, who is exceptionally tall at .
Compare the mean and median of the heights of the learners before and after the eleventh learner was included.(6)Show the memo (6 ticks)Memo
- ✓Mean of 10 learnersmean
1 mark · Calculate the mean
- ✓Mean of 11 learnersmean
1 mark · Calculate the mean
- ✓Median of 10 learnersSorted:
median1 mark · Find the median
- ✓Median of 11 learnersSorted:
median sixth value1 mark · Find the median
- ✓Compare the changesThe mean changes by when the outlier (the tall learner) is added, but the median changes by only .
1 mark · Interpret data and draw conclusions
- ✓ConclusionIn general, the median is less affected by the addition of outliers to a data set than the mean is.
1 mark · Interpret data and draw conclusions
- ✓
4. Question a · Siyavula Grade 12 Mathematics, 9.2 Curve fitting, Worked example 4 · 1 mark
Examine the scatter plot below of data collected from a new shop: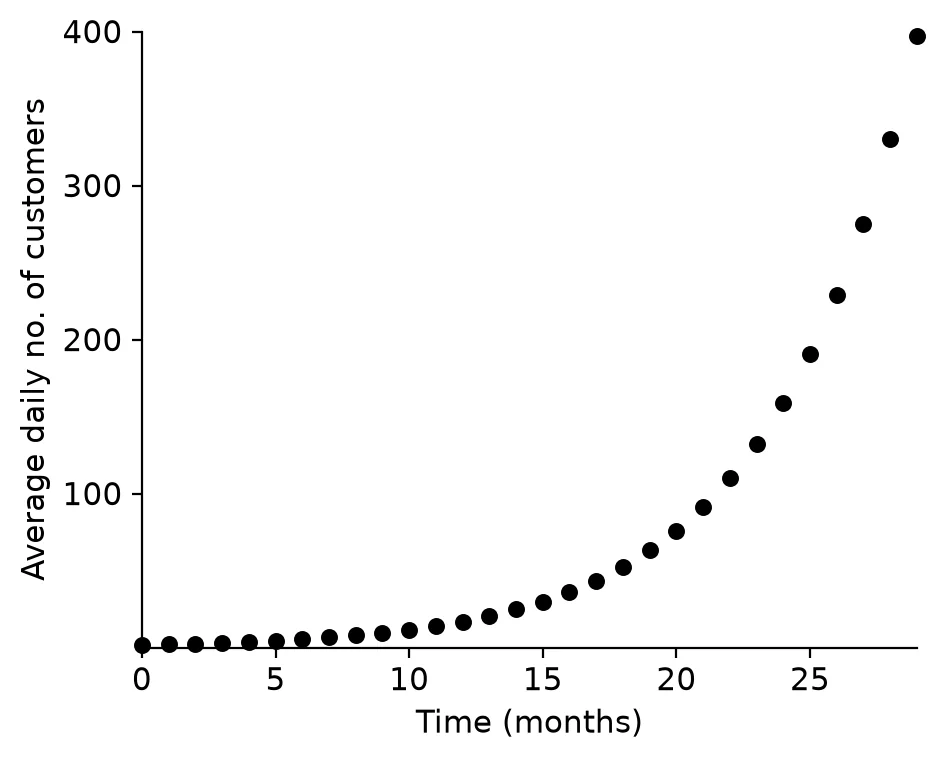 a What are the two variables being compared?(1)
Show the memo (1 tick)Memo
- ✓VariablesThe variables being compared are average daily number of customers and time in months.
1 mark · Interpret data and draw conclusions
- ✓
Free on Android
Know exactly which skill is costing you marks.
Mark past papers tick by tick in the NavyBlue app. It remembers every mark you lose, shows you the skills to fix first, and picks your next questions.
Get NavyBlue free on Google Play
