Grade 11 Maths · Paper 2
Statistics Grade 11
Real past paper questions and answers from 2024 to 2025, with each memo split into the ticks examiners give. Try one, mark yourself, and see exactly which skill cost you marks.
- past paper questions
- 33 past paper questions
- skills
- 8 skills
- videos
- 8 videos
Try a real exam question
No sign-up. Takes 3 minutes.
Question 1.3 · May/June 2025 · Paper 2 · National (DBE) · 2 marks
134, 215, 325, 326, 362, 429, 515, 531, 598, 610, 624, 728, 923, 1034, 1200
Work it out on paper first. Then mark yourself with the official memo, one tick at a time.
What's in Statistics Grade 11
Each skill is one thing a memo gives a tick for. Tap a skill for its own questions, notes and videos.
Histograms and Frequency Polygons
Ogives16 past paper questions
- Read and complete a frequency tableRead and fill in a frequency table, for example find a missing count or how many learners scored below 50.15 past paper questions · 3 videos
- Draw a histogram, polygon or ogiveDraw a histogram, frequency polygon or ogive from a frequency table, with correct scales, labels and heights.6 past paper questions · 3 videos
- Read values from an ogiveRead values off an ogive (cumulative frequency curve), for example the median, or how many learners scored less than 60.7 past paper questions · 3 videos
- Draw an ogiveDraw an ogive by plotting each cumulative frequency at the upper end of its class and joining the points with a smooth curve.3 past paper questions · 3 videos
Variance and Standard Deviation10 past paper questions
Symmetrical and Skewed Data7 past paper questions
- Interpret data and draw conclusionsExplain what data shows in real life, for example compare two classes' results or say whether a graph is misleading.4 past paper questions · 4 videos
- Draw a box and whisker diagramDraw a box and whisker diagram from the minimum, quartiles, median and maximum on a number line, and read values from one.5 past paper questions · 3 videos
- Describe skewness and outliersSay whether data is symmetric, skewed left or skewed right, and spot outliers, for example when the mean is much bigger than the median.6 past paper questions · 3 videos
More Statistics Grade 11 questions and answers
Try each one on paper before you open the memo.
1. Question 1.4 · November 2025 · Paper 2 · Provincial · 2 marks
The following data represent the prize allocation (in R1 000) for the top ten male finishers in the 2025 20 km Marathon, listed in descending order from 10th place to the first place. Note that the prize money for 6th place and 3rd place were not disclosed.
The mean prize across the available data is R21 770.
The prizes are shown in the table below. 1.4 Determine the standard deviation of the prize money.(2)
Show the memo (1 tick)Memo
- ✓Answer (✓✓)
2 marks · Calculate and use standard deviation
- ✓
2. Question 2.1 · November 2024 · Paper 2 · Provincial · 2 marks
The weight of the boxers who underwent fitness and health checks is shown in the frequency table below.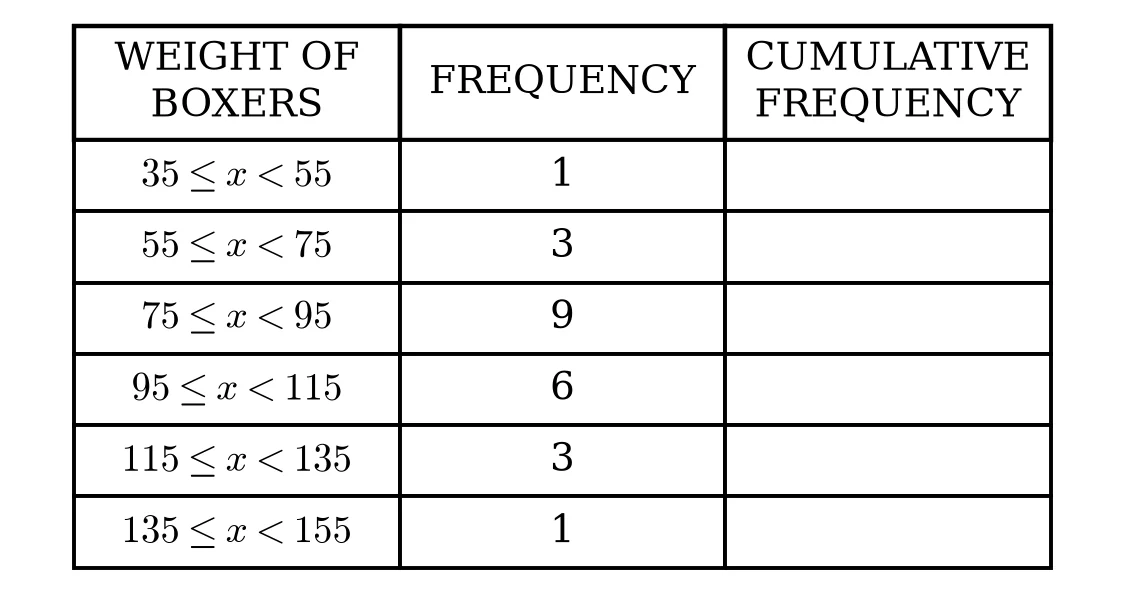 2.1 Complete the cumulative frequency column provided in the table in the ANSWER BOOK.(2)
Show the memo (2 ticks)Memo
- ✓4 and 13Cumulative frequencies: 1; 4; 13; ...
1 mark · Read and complete a frequency table
- ✓19 and 22...; 19; 22; 23
1 mark · Read and complete a frequency table
- ✓
3. Question 1.4.1 · November 2024 · Paper 2 · Provincial · 1 mark
The traffic department set up a roadblock on the N12 between Potchefstroom and Klerksdorp. During the first hour, they stopped 11 minibus taxis.
The following dataset is a summary of the number of passengers per minibus taxi.
18, 26, 25, 18, 16, 12, 10, 8, 18, 17, 81.4 During the second hour of the roadblock, a further 5 minibus taxis were stopped. The number of passengers in these 5 taxis are: , 13, 18, , 20.
These 5 numbers are already arranged from smallest to largest.
The entire dataset for the first and second hours is collectively represented on a box-and-whisker diagram. The new average number of passengers for the 16 taxis is 16. The five-number summary can be seen on the diagram below.
Answer the questions that follow.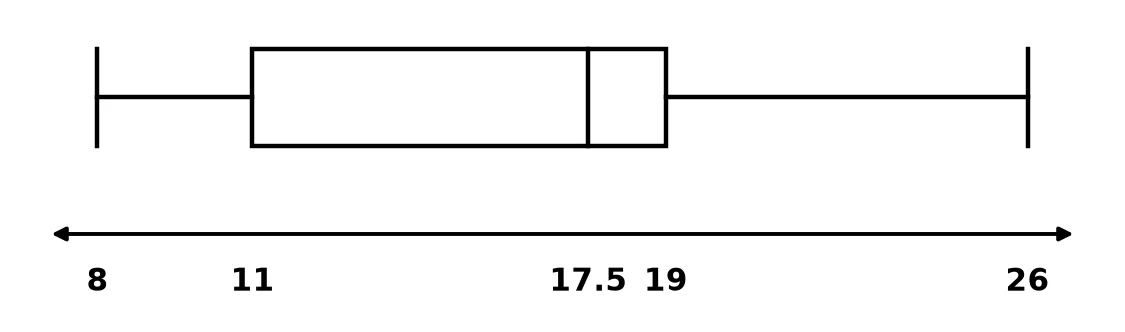 1.4.1 Discuss the skewness of the data.(1)
Show the memo (1 tick)Memo
- ✓AnswerSkewed to the left.
1 mark · Describe skewness and outliers
- ✓
4. Question WE11 · Siyavula Grade 11 Mathematics, 11.4 Variance and standard deviation, Worked example 11 · 3 marks
WE11 What is the variance and standard deviation of the possibilities associated with rolling a fair die?(3)Show the memo (3 ticks)Memo
- ✓MeanThe data set is and .
1 mark · Calculate the mean
- ✓Variance
1 mark · Calculate and use standard deviation
- ✓Standard deviation
1 mark · Calculate and use standard deviation
- ✓
5. Question 2.1 · November 2024 · Paper 2 · Provincial · 2 marks
The traffic department has also conducted further investigation into where the best locations would be on the N12 to install speed cameras. Part of the investigation involved a survey of the different speeds of vehicles on the N12 between Potchefstroom and Klerksdorp.
The following table shows the results of the investigation: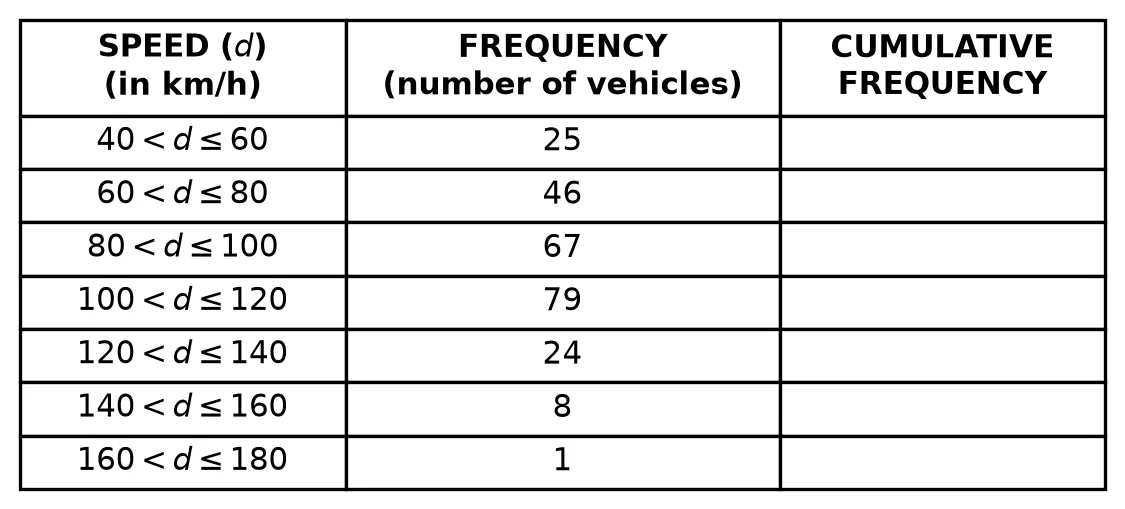 2.1 Use the table in the answer book and complete the cumulative frequency column.(2)
Show the memo (2 ticks)Memo
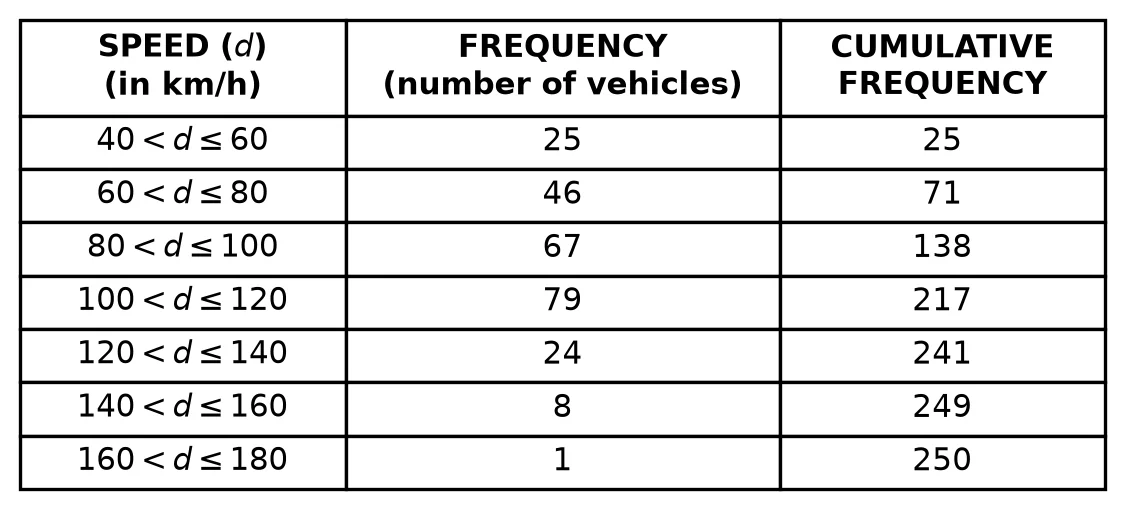
- ✓First three cumulative frequenciesCumulative frequencies: 25, 71, 138
1 mark · Read and complete a frequency table
- ✓Last four cumulative frequenciesCumulative frequencies: 217, 241, 249, 250
1 mark · Read and complete a frequency table
- ✓
Statistics Grade 11 videos
Short lessons from South African teachers first. Videos load only when you tap play, to save your data.
Free on Android
Know exactly which skill is costing you marks.
Mark past papers tick by tick in the NavyBlue app. It remembers every mark you lose, shows you the skills to fix first, and picks your next questions.
Get NavyBlue free on Google Play
