Grade 10 Maths · Statistics
Describe skewness and outliers
Say whether data is symmetric, skewed left or skewed right, and spot outliers, for example when the mean is much bigger than the median.
- past paper questions use it
- 6 past paper questions use it
- videos
- 3 videos
Learn it: describe skewness and outliers
Pick one and watch it, then try the questions below. Videos load only when you tap play.
Now try it on a real exam question
No sign-up. Takes 3 minutes.
Question c · Siyavula Grade 12 Mathematics, 9.1 Revision, Worked example 3 · 3 marks
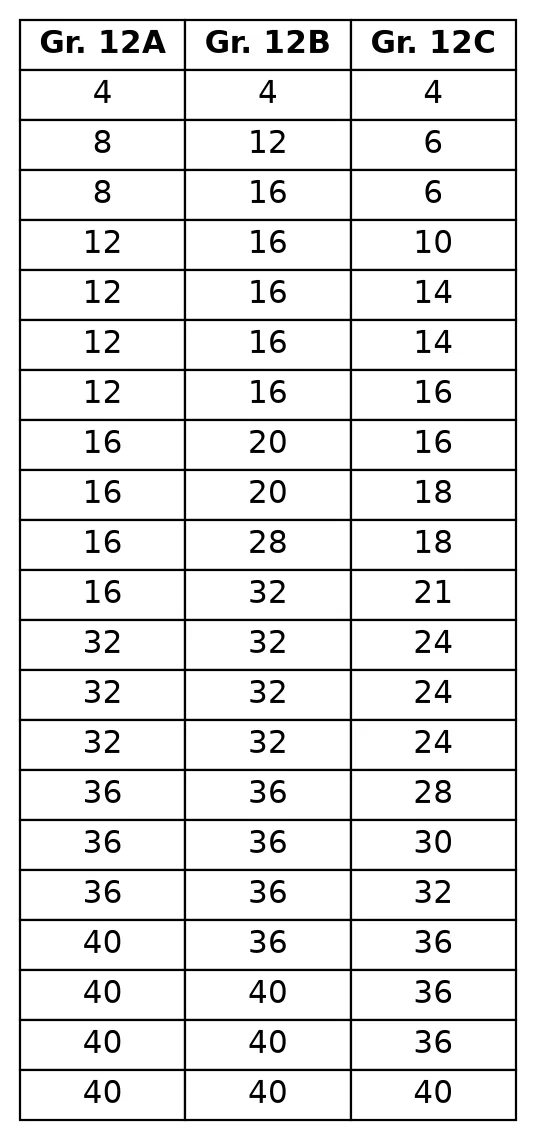
Work it out on paper first. Then mark yourself with the official memo, one tick at a time.
More past paper questions: describe skewness and outliers
Work each one out first, then open the memo and check every tick.
3. Question 1.4.1 · November 2024 · Paper 2 · Provincial · 1 mark
The traffic department set up a roadblock on the N12 between Potchefstroom and Klerksdorp. During the first hour, they stopped 11 minibus taxis.
The following dataset is a summary of the number of passengers per minibus taxi.
18, 26, 25, 18, 16, 12, 10, 8, 18, 17, 81.4 During the second hour of the roadblock, a further 5 minibus taxis were stopped. The number of passengers in these 5 taxis are: , 13, 18, , 20.
These 5 numbers are already arranged from smallest to largest.
The entire dataset for the first and second hours is collectively represented on a box-and-whisker diagram. The new average number of passengers for the 16 taxis is 16. The five-number summary can be seen on the diagram below.
Answer the questions that follow.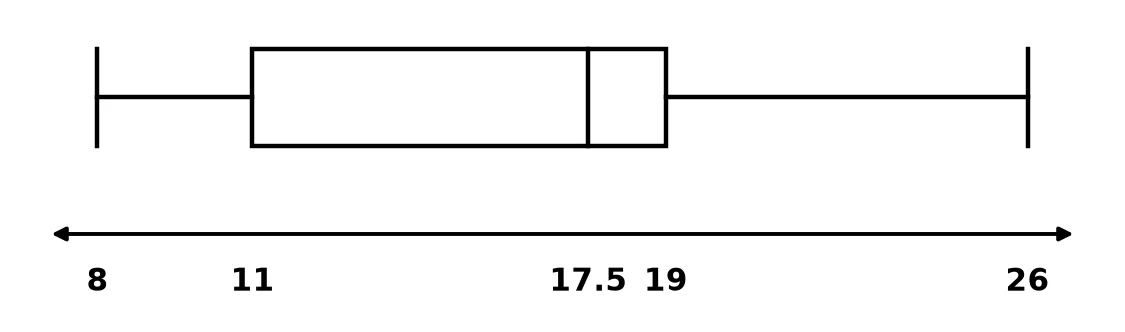 1.4.1 Discuss the skewness of the data.(1)
Show the memo (1 tick)Memo
- ✓AnswerSkewed to the left.
1 mark · Describe skewness and outliers
- ✓
4. Question 1.4 · November 2024 · Paper 2 · Provincial · 1 mark
Mr Baloyi conducted a survey on the amount of airtime (in Rands) EACH learner had on his or her cellphone.
The data is: 12, 16, 30, 26, 20, 22, 32, 38, 40, 46, 54, 60, 68.1.4 Comment on the skewness of the data.(1)Show the memo (1 tick)Memo
- ✓Identify skewnessThe data is skewed to the right (positively skewed).
1 mark · Describe skewness and outliers
- ✓
5. Question 1.2 · November 2024 · Paper 2 · Provincial · 1 mark
After utilising GeoGebra to teach geometry, the 14 participants marks out of 100 are displayed in the table below.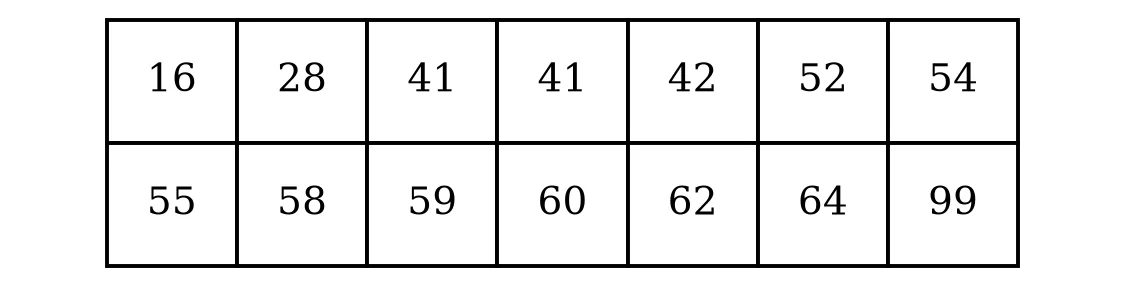 1.2 Identify any outlier.(1)
Show the memo (1 tick)Memo
- ✓OutlierOutlier
1 mark · Describe skewness and outliers
- ✓
Free on Android
Know exactly which skill is costing you marks.
Mark past papers tick by tick in the NavyBlue app. It remembers every mark you lose, shows you the skills to fix first, and picks your next questions.
Get NavyBlue free on Google Play
