Grade 10 Maths · Statistics · Find quartiles, range and IQR
Quartiles and Interquartile Range Grade 10
Find the quartiles, range and interquartile range of ordered data, for example in 2, 4, 6, 8, 10, 12, 14 the IQR is 12 − 4 = 8.
- past paper questions use it
- 11 past paper questions use it
- videos
- 3 videos
Learn it: find quartiles, range and iqr
Pick one and watch it, then try the questions below. Videos load only when you tap play.
Now try it on a real exam question
No sign-up. Takes 3 minutes.
Question 2.6 · November 2025 · Paper 2 · Provincial · 2 marks
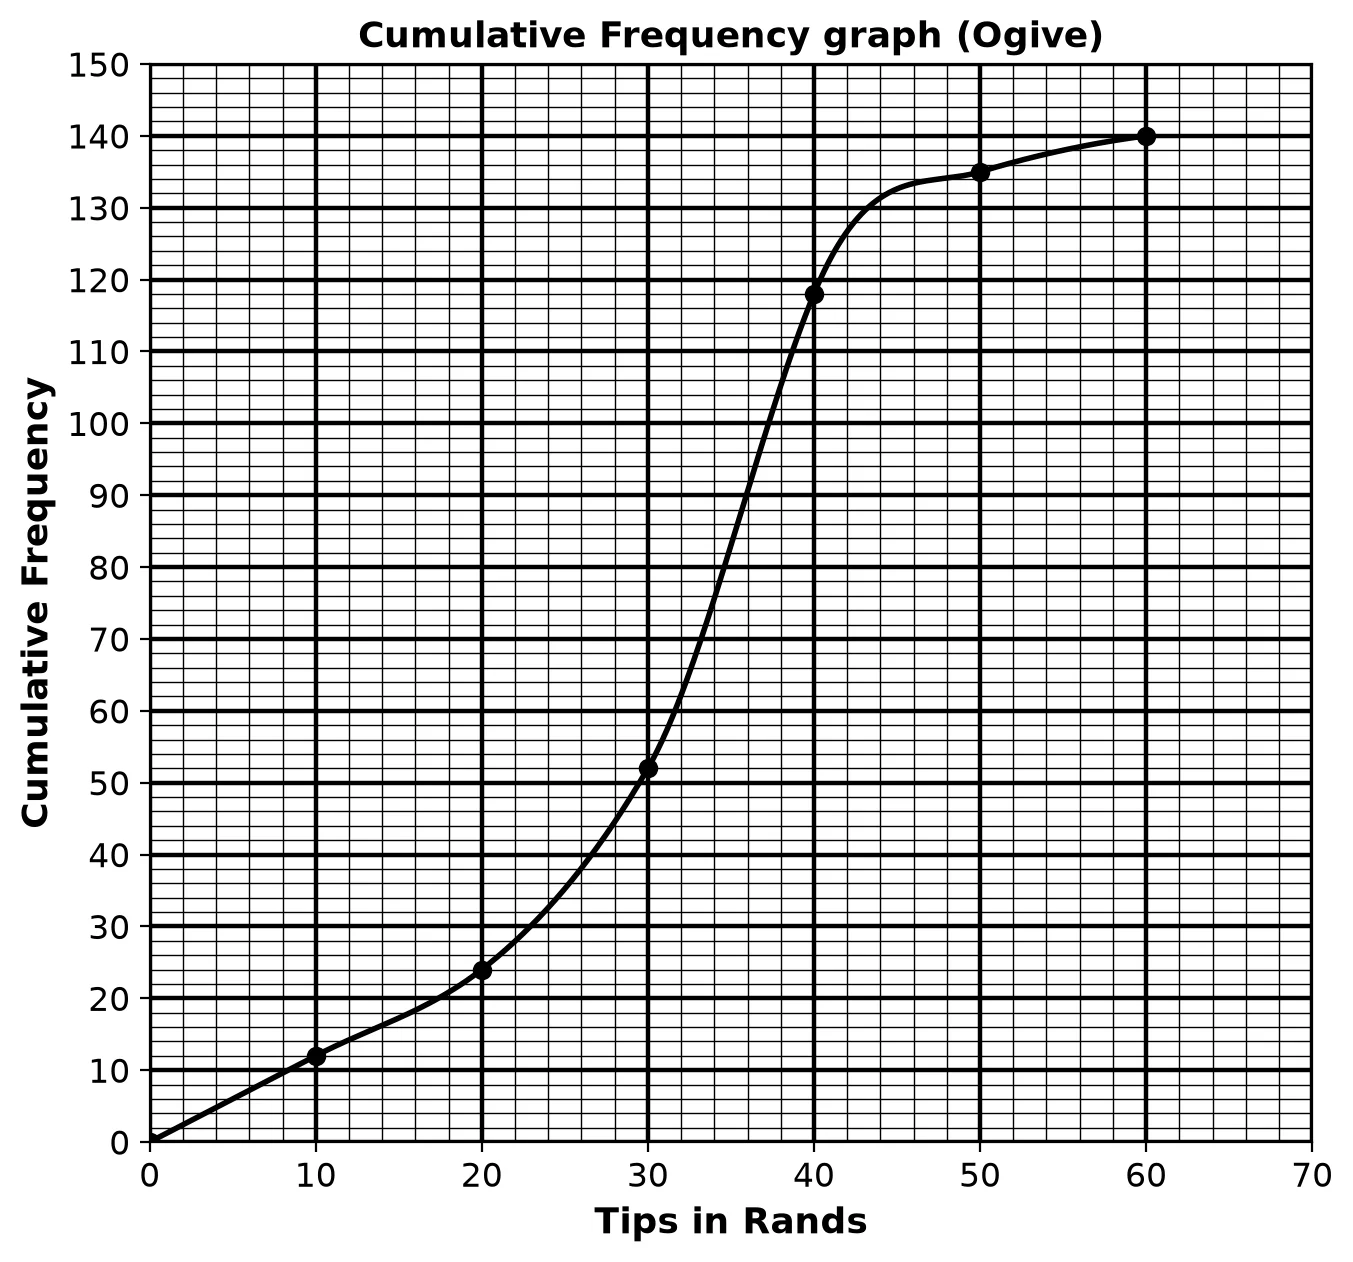
Work it out on paper first. Then mark yourself with the official memo, one tick at a time.
More past paper questions: find quartiles, range and iqr
Work each one out first, then open the memo and check every tick.
3. Question 1.4 · November 2024 · Paper 2 · Provincial · 3 marks
After utilising GeoGebra to teach geometry, the 14 participants marks out of 100 are displayed in the table below.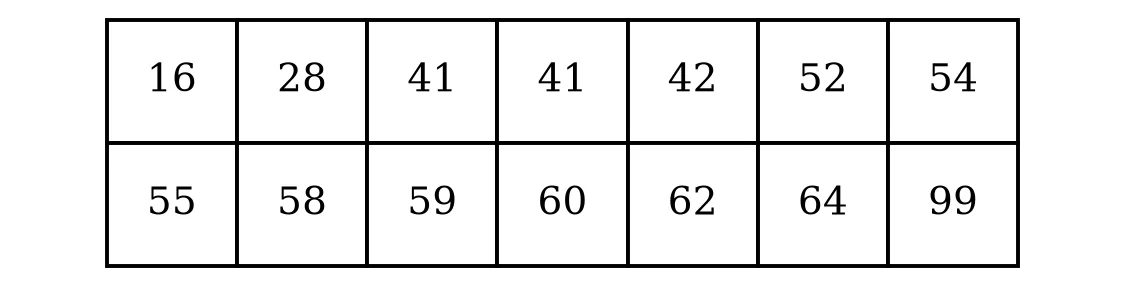 1.4 Determine the interquartile range of the data.(3)
Show the memo (3 ticks)Memo
- ✓
1 mark · Find quartiles, range and IQR
- ✓
1 mark · Find quartiles, range and IQR
- ✓Answer
1 mark · Find quartiles, range and IQR
- ✓
4. Question 5.2.3 · September 2024 · Provincial · 3 marks
The following Life Sciences marks, for a test out of 50, were recorded from 15 grade 10 learners at a certain school. 5.2 Determine:5.2.3 The interquartile range.(3)
Show the memo (2 ticks)Memo
- ✓(double tick), :
2 marks · Find quartiles, range and IQR
- ✓Answer
1 mark · Find quartiles, range and IQR
- ✓
5. Question 1.4.3 · November 2024 · Paper 2 · Provincial · 4 marks
The traffic department set up a roadblock on the N12 between Potchefstroom and Klerksdorp. During the first hour, they stopped 11 minibus taxis.
The following dataset is a summary of the number of passengers per minibus taxi.
18, 26, 25, 18, 16, 12, 10, 8, 18, 17, 81.4 During the second hour of the roadblock, a further 5 minibus taxis were stopped. The number of passengers in these 5 taxis are: , 13, 18, , 20.
These 5 numbers are already arranged from smallest to largest.
The entire dataset for the first and second hours is collectively represented on a box-and-whisker diagram. The new average number of passengers for the 16 taxis is 16. The five-number summary can be seen on the diagram below.
Answer the questions that follow.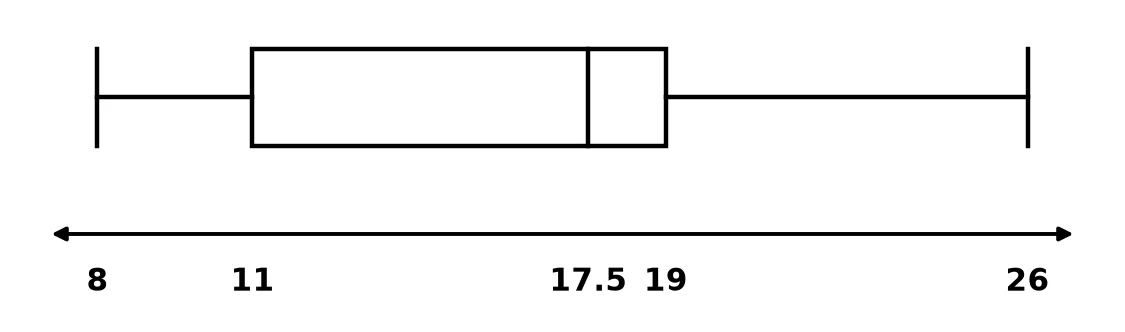 1.4.3 Calculate the value of and .(4)
Show the memo (4 ticks)Memo
- ✓Position of , 8, 8, 10, 12, 13, 16, 17, 18, 18, 18, 18, , 20, 25, 26
position1 mark · Find quartiles, range and IQR
- ✓Value of Between 12th and 13th position
1 mark · Find quartiles, range and IQR
- ✓New mean equationNew :
1 mark · Calculate the mean
- ✓Value of
1 mark · Calculate the mean
- ✓
6. Question WE10 · Siyavula Grade 10 Mathematics, 10.4 Measures of dispersion, Worked example 10 · 3 marks
WE10 Find the range of the following data set:
What would happen if we removed the first value from the set?(3)Show the memo (3 ticks)Memo
- ✓RangeThe smallest value is and the largest value is .
Range1 mark · Find quartiles, range and IQR
- ✓Range without the first valueIf were removed, the minimum would be .
Range1 mark · Find quartiles, range and IQR
- ✓Effect of the outlier is not typical of the other values. It is an outlier and has a big influence on the range.
1 mark · Interpret data and draw conclusions
- ✓
Free on Android
Know exactly which skill is costing you marks.
Mark past papers tick by tick in the NavyBlue app. It remembers every mark you lose, shows you the skills to fix first, and picks your next questions.
Get NavyBlue free on Google Play
