Grade 12 Maths · Statistics
Find and describe the correlation
Find the correlation coefficient r on a calculator and describe the link between two variables, for example r = 0,92 is strong and positive.
- past paper questions use it
- 6 past paper questions use it
- videos
- 4 videos
Learn it: find and describe the correlation
Pick one and watch it, then try the questions below. Videos load only when you tap play.
Now try it on a real exam question
No sign-up. Takes 3 minutes.
Question d · Siyavula Grade 12 Mathematics, 9.3 Correlation, Worked example 9 · 3 marks

Work it out on paper first. Then mark yourself with the official memo, one tick at a time.
More past paper questions: find and describe the correlation
Work each one out first, then open the memo and check every tick.
3. Question c · Siyavula Grade 12 Mathematics, 9.2 Curve fitting, Worked example 4 · 1 mark
Examine the scatter plot below of data collected from a new shop: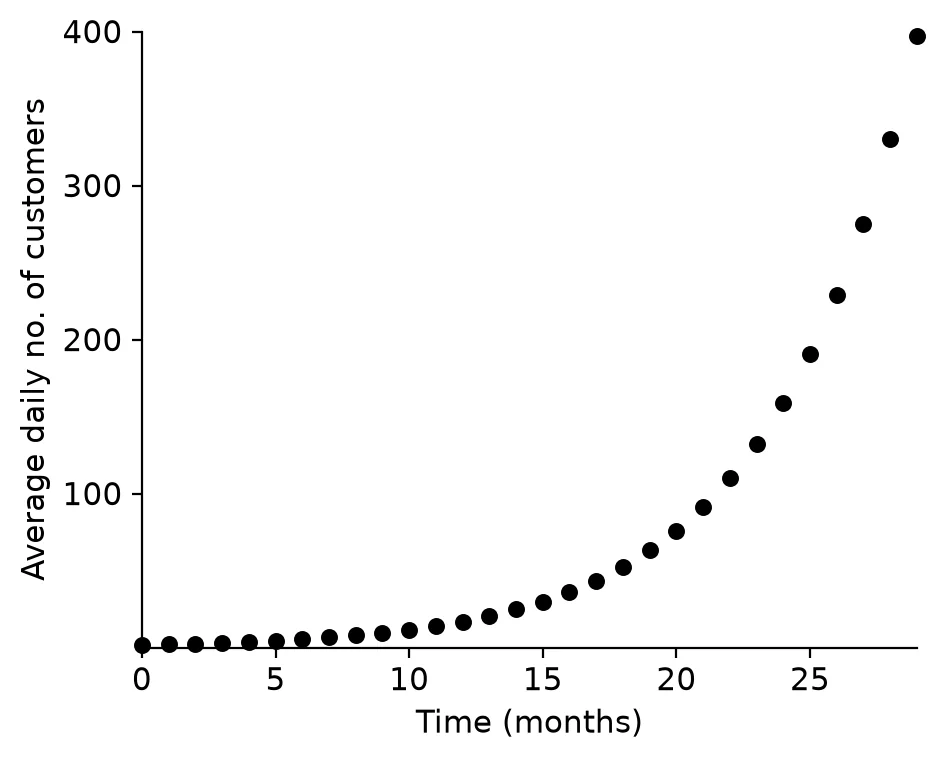 c Is the relationship between the two variables strong or weak?(1)
Show the memo (1 tick)Memo
- ✓StrengthThe data points appear to fit the curve close to perfectly, so the relationship can be described as very strong.
1 mark · Find and describe the correlation
- ✓
Free on Android
Know exactly which skill is costing you marks.
Mark past papers tick by tick in the NavyBlue app. It remembers every mark you lose, shows you the skills to fix first, and picks your next questions.
Get NavyBlue free on Google Play
