Grade 12 Maths · Statistics
Find the regression line
Use a calculator to find the line of best fit for paired data and write it as y = a + bx, for example y = 3,2 + 1,5x.
- past paper questions use it
- 5 past paper questions use it
- videos
- 4 videos
Learn it: find the regression line
Pick one and watch it, then try the questions below. Videos load only when you tap play.
Now try it on a real exam question
No sign-up. Takes 3 minutes.
Question 2.2 · May/June 2025 · Paper 2 · National (DBE) · 3 marks
The supermarket received online orders on a certain day. The information for these orders is shown below.
Number of items (x): 10, 3, 20, 14, 17, 9, 12, 18, 15, 19
Time (in minutes) (y): 5, 5, 9, 7, 6, 6, 8, 11, 10, 12
Work it out on paper first. Then mark yourself with the official memo, one tick at a time.
More past paper questions: find the regression line
Work each one out first, then open the memo and check every tick.
3. Question a · Siyavula Grade 12 Mathematics, 9.2 Curve fitting, Worked example 8 · 3 marks
The Chemistry and Accounting marks of five learners are given in the table.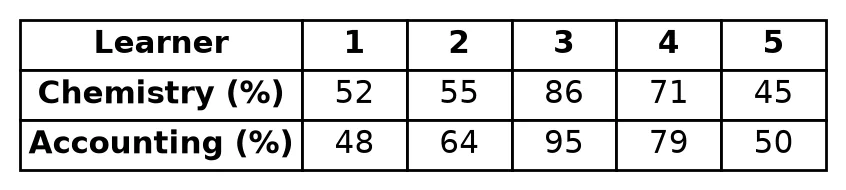 a Using a calculator determine the least squares line of best fit for the data set.(3)
Show the memo (3 ticks)Memo
- ✓a (to two decimal places)
1 mark · Find the regression line
- ✓b (to two decimal places)
1 mark · Find the regression line
- ✓Equation
1 mark · Find the regression line
- ✓
4. Question WE7 · Siyavula Grade 12 Mathematics, 9.2 Curve fitting, Worked example 7 · 3 marks
 WE7 Using a calculator, find the equation of the least squares regression line for the following data:(3)
Show the memo (3 ticks)Memo
- ✓aEnter the five pairs in statistics (regression) mode and recall :
1 mark · Find the regression line
- ✓bRecall :
1 mark · Find the regression line
- ✓Equation
1 mark · Find the regression line
- ✓
5. Question b · Siyavula Grade 12 Mathematics, 9.3 Correlation, Worked example 9 · 3 marks
A cardiologist wanted to test the relationship between resting heart rate and the peak heart rate during exercise. Heart rate is measured in beats per minute (bpm). The following set of data was generated from study participants after they had run on a treadmill at for minutes. b Use your calculator to determine the equation of the line of best fit.(3)
Show the memo (3 ticks)Memo
- ✓a
1 mark · Find the regression line
- ✓b
1 mark · Find the regression line
- ✓Equation
1 mark · Find the regression line
- ✓
Free on Android
Know exactly which skill is costing you marks.
Mark past papers tick by tick in the NavyBlue app. It remembers every mark you lose, shows you the skills to fix first, and picks your next questions.
Get NavyBlue free on Google Play
