Grade 12 Physical Sciences · Mechanics
Sketch projectile motion graphs
Sketch position-time, velocity-time or acceleration-time graphs for a ball thrown up or bouncing, with the right shape and key values.
- past paper questions use it
- 7 past paper questions use it
- videos
- 3 videos
Learn it: sketch projectile motion graphs
Pick one and watch it, then try the questions below. Videos load only when you tap play.
Now try it on a real exam question
No sign-up. Takes 3 minutes.
Question 1.2 · November 2025 · Paper 1 · National (DBE) · 2 marks
Ignore the effects of friction on the stone.(2)
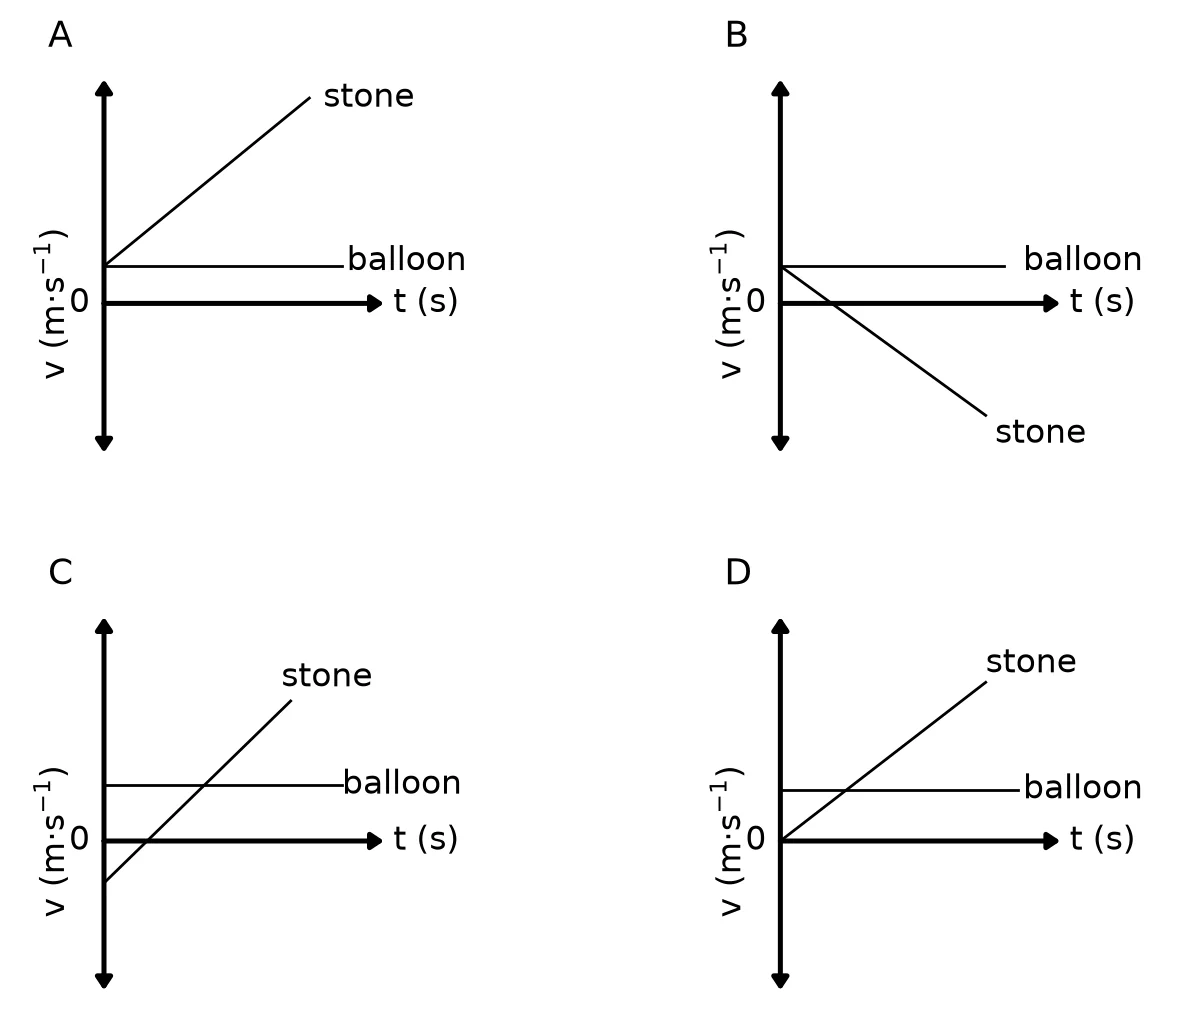
Work it out on paper first. Then mark yourself with the official memo, one tick at a time.
More past paper questions: sketch projectile motion graphs
Work each one out first, then open the memo and check every tick.
3. Question 3.5 · November 2025 · Paper 1 · National (DBE) · 4 marks
A ball is projected vertically upwards from the top of a building that is m high. Ignore the effects of friction.
The table below shows the magnitude of the velocity of the ball at THREE different times during its motion.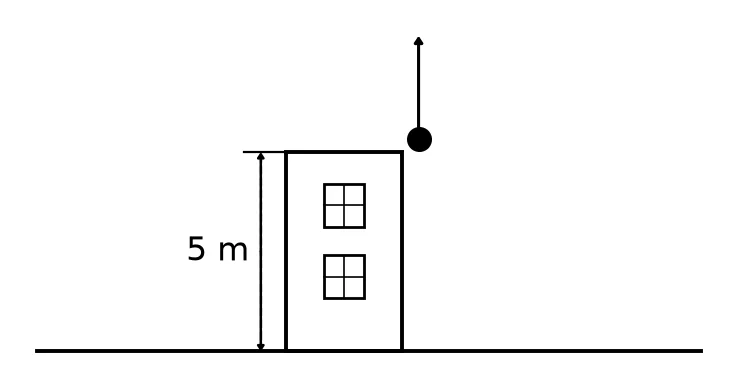
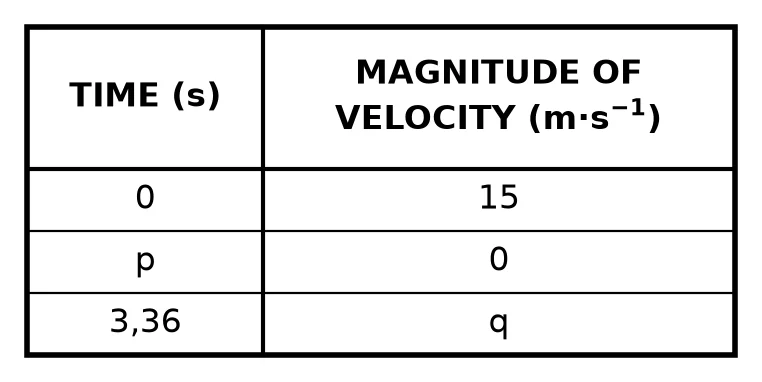 3.5 Sketch a velocity versus time graph for the motion of the ball from the time it was projected until it reached the maximum height after it bounced.
Show the following NUMERICAL VALUES on the graph:
• The initial velocity
• Time p
• Velocity q(4)Show the memo (4 ticks)Memo
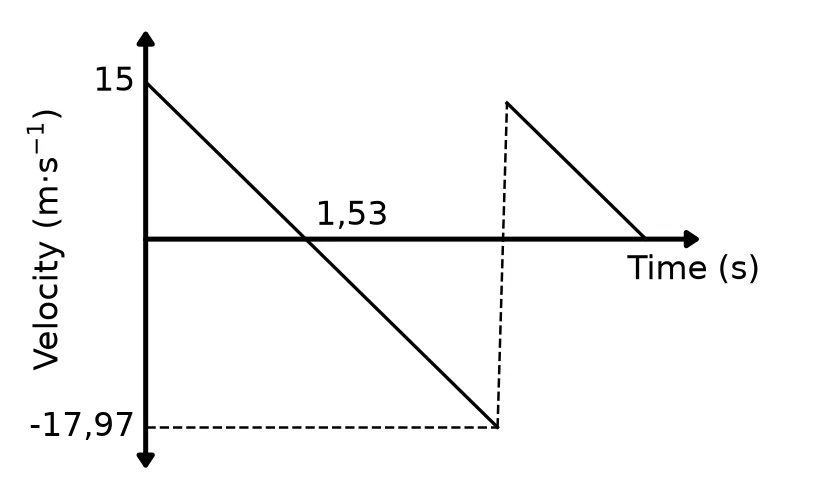
- ✓Initial velocity and shapeUpwards as positive: a straight line starting at m·s with a negative final velocity (or, downwards as positive, a straight line starting at m·s with a positive final velocity).
1 mark · Sketch projectile motion graphs
- ✓Time pThe straight line cuts the time axis at the time calculated in Question 3.2 ( s).
1 mark · Sketch projectile motion graphs
- ✓Velocity qCorrect velocity as calculated in Q 3.3 ( m·s with upwards positive) when the ball is on the ground.
1 mark · Sketch projectile motion graphs
- ✓After the bounceThe velocity of the second line is less than calculated in Q 3.3, the lines are drawn parallel and it ends at .
1 mark · Sketch projectile motion graphs
- ✓
4. Question 3.2 · November 2024 · Paper 1 · National (DBE) · 4 marks
Ball A is thrown vertically upwards at m·s from the top of a building. Two seconds after ball A was thrown upwards, ball B is thrown vertically downwards at m·s from the top of the same building. Both balls, A and B, strike the ground at time t seconds.
Ignore the effects of air friction.
The position-time sketch graphs for both balls are shown below.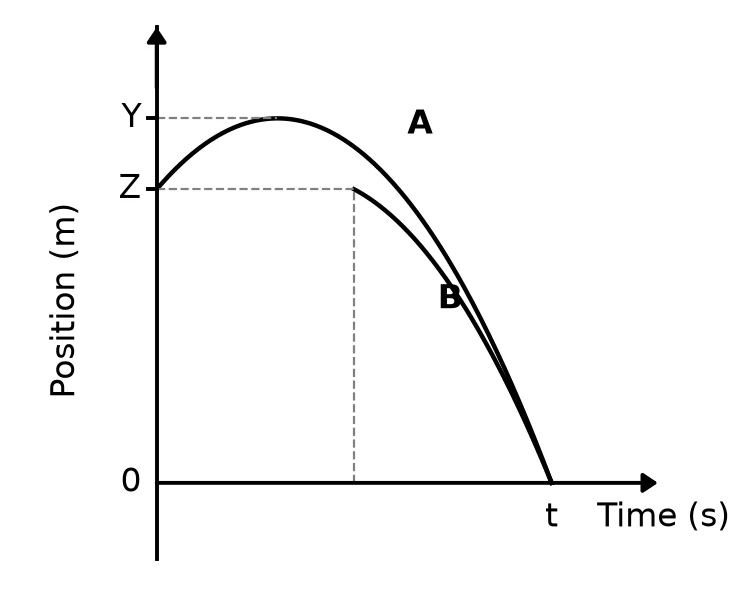 3.2 On the same set of axes, sketch the velocity-time graphs for ball A and ball B while they are in free fall. Label the graphs A and B for ball A and ball B respectively.
Clearly indicate the following on the graphs:
- The initial velocity of each ball
- The time at which each ball is thrown
- The time at which the balls strike the ground(4)Show the memo (4 ticks)Memo
- ✓Initial velocities and shapeUpwards positive: ball A starts at m·s and ball B at m·s; both graphs are straight lines with negative slopes.
(Downwards positive: and , both slopes positive.)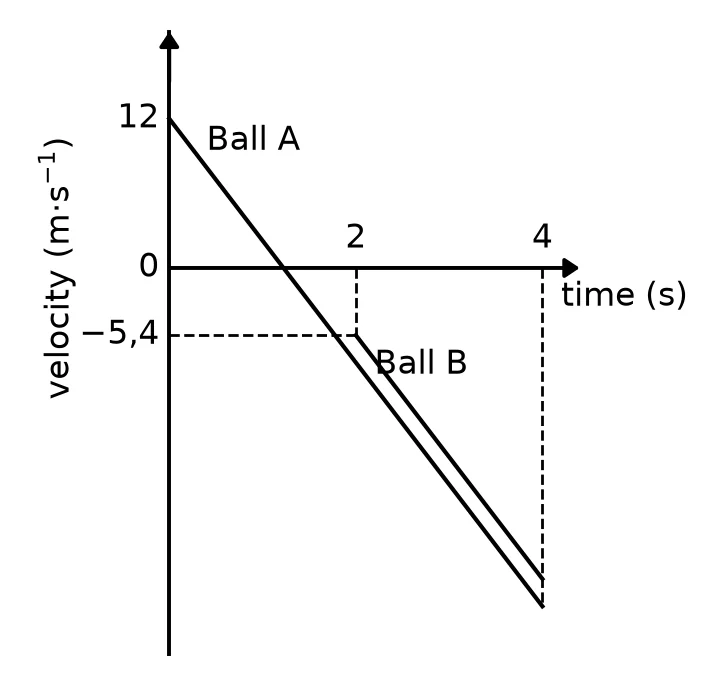
1 mark · Sketch projectile motion graphs
- ✓Initial timesBall A starts at ; ball B starts at s, after the point where graph A crosses the time axis.
1 mark · Sketch projectile motion graphs
- ✓End timesBoth graphs end at s (accept t).
1 mark · Sketch projectile motion graphs
- ✓Parallel linesThe two graphs are parallel to each other, with B to the right of A.
1 mark · Sketch projectile motion graphs
- ✓
5. Question 3.3 · May/June 2023 · Paper 1 · National (DBE) · 5 marks
Ball A is dropped from rest from the top of a building m high.
After ball A has fallen m, a second ball B is projected vertically upwards from the ground. After a while, the two balls strike the ground at the SAME time.
Ignore the effects of air resistance.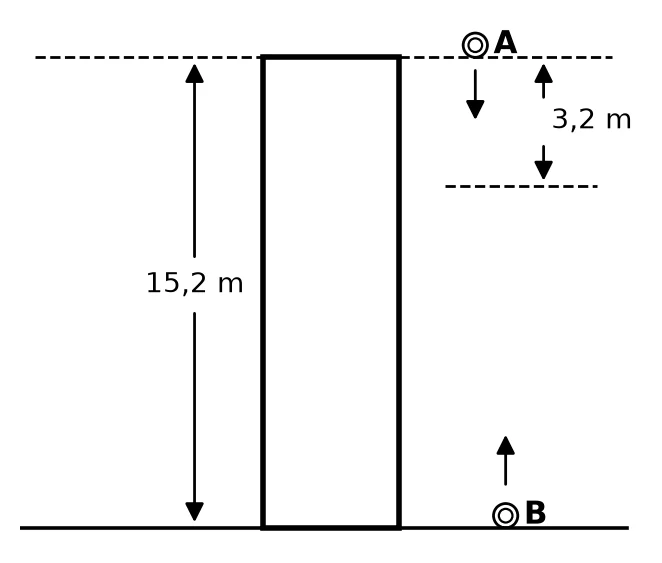 3.3 On the same system of axes, draw position-time graphs to show the motions of both ball A and ball B from the instant ball A is dropped until the time it reaches the ground.
Take the ground as the zero position.
Label the graphs A and B.
Clearly indicate the following on the graphs:
• The starting time for each ball
• The initial position of each ball
• The time when the balls strike the ground(5)Show the memo (5 ticks)Memo
- ✓Initial positionsGraph A starts at 15,2 m and graph B starts at 0 m (upwards positive).
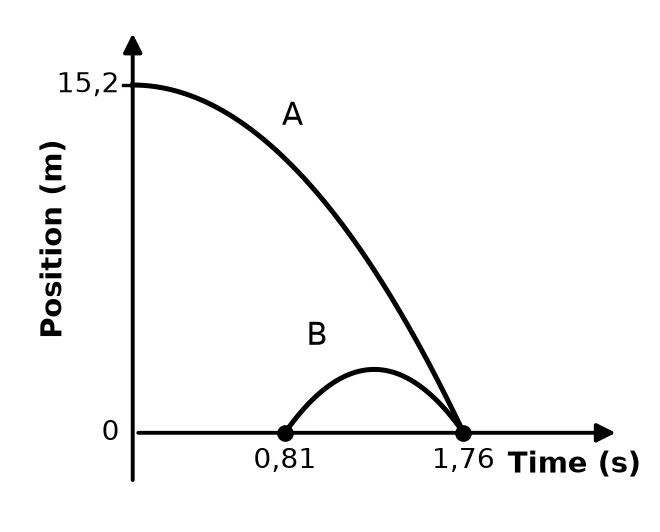
1 mark · Sketch projectile motion graphs
- ✓Starting timesA starts at t = 0 s and B starts at t = 0,81 s.
1 mark · Sketch projectile motion graphs
- ✓Both reach the ground at 1,76 sBoth graphs reach position 0 at t = 1,76 s.
1 mark · Sketch projectile motion graphs
- ✓Shape of graph AGraph A is a curve starting at 15,2 m, getting steeper as time goes on (a downward-opening parabola from its peak at t = 0).
1 mark · Sketch projectile motion graphs
- ✓Shape of graph BGraph B is an upside-down parabola: it rises from 0 at 0,81 s to a maximum and comes back to 0 at 1,76 s.
1 mark · Sketch projectile motion graphs
- ✓
6. Question 3.3 · November 2022 · Paper 1 · National (DBE) · 3 marks
A ball is thrown vertically upwards from the top of a building of height m with a velocity of m·s. On its way down, the ball passes a door which has a height of m and then strikes the ground, as shown in the diagram below.
Ignore the effects of air friction.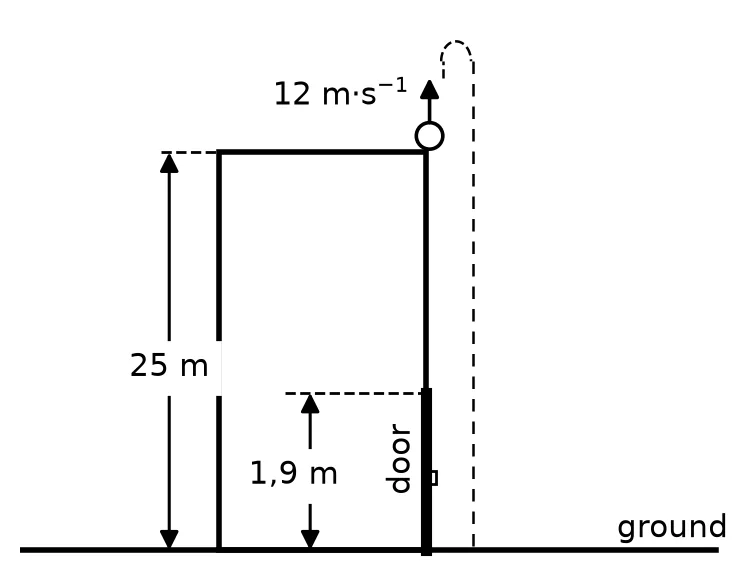 3.3 Draw a velocity versus time graph for the motion of the ball from the moment that the ball is thrown upwards until it strikes the ground. Use the ground as zero reference.
Clearly indicate the following on your graph:
• The velocity with which the ball was thrown upwards
• Time taken by the ball to reach its maximum height
• The velocity with which the ball strikes the ground(3)Show the memo (3 ticks)Memo
- ✓Straight line, correct startUpwards as positive: a straight line starting at m·s and ending at a negative final velocity.
(Downwards as positive: a straight line starting at m·s with a positive final velocity.)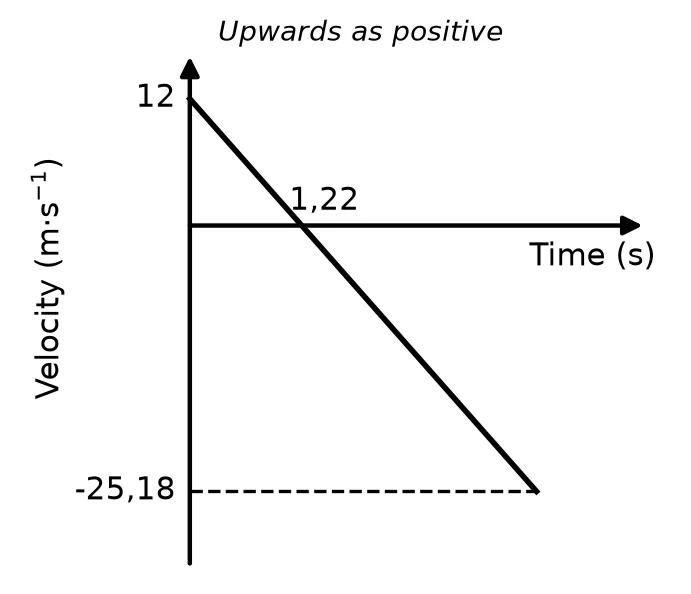
1 mark · Sketch projectile motion graphs
- ✓Cuts time axis at sThe line cuts the time axis at s (the time calculated in Question 3.2.1).
1 mark · Sketch projectile motion graphs
- ✓Final velocity indicatedThe final velocity m·s (as calculated in Question 3.2.2) is indicated at the end of the line.
1 mark · Sketch projectile motion graphs
- ✓
Free on Android
Know exactly which skill is costing you marks.
Mark past papers tick by tick in the NavyBlue app. It remembers every mark you lose, shows you the skills to fix first, and picks your next questions.
Get NavyBlue free on Google Play
