Grade 10 Physical Sciences · Mechanics
Sketch motion graphs
Sketch the position-time, velocity-time or acceleration-time graph that matches a described motion (constant velocity gives a straight sloping position-time line).
- past paper questions use it
- 4 past paper questions use it
- videos
- 3 videos
Learn it: sketch motion graphs
Pick one and watch it, then try the questions below. Videos load only when you tap play.
Now try it on a real exam question
No sign-up. Takes 3 minutes.
Question 5.5 · May/June 2023 · Paper 1 · National (DBE) · 4 marks
The motor exerts a constant force of N parallel to the inclined plane on the rope.
A constant frictional force of N acts on the crate as it moves on the inclined plane.
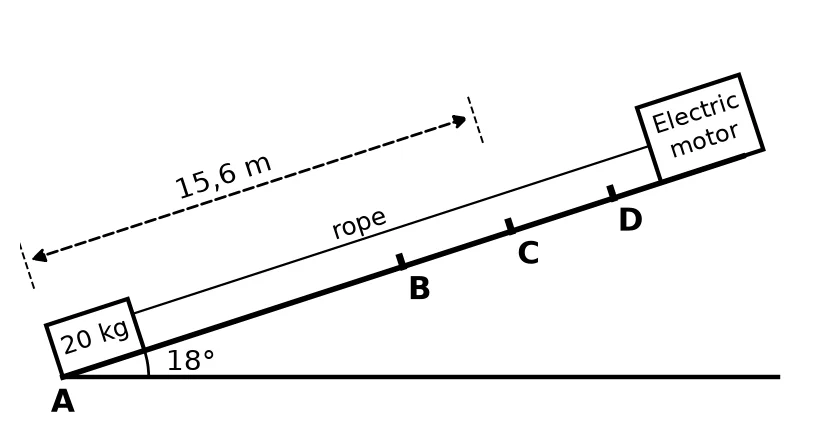
Work it out on paper first. Then mark yourself with the official memo, one tick at a time.
More past paper questions: sketch motion graphs
Work each one out first, then open the memo and check every tick.
3. Question WE6 · Siyavula Grade 10 Physical Sciences, 21.6 Description of motion, Worked example 6 · 4 marks
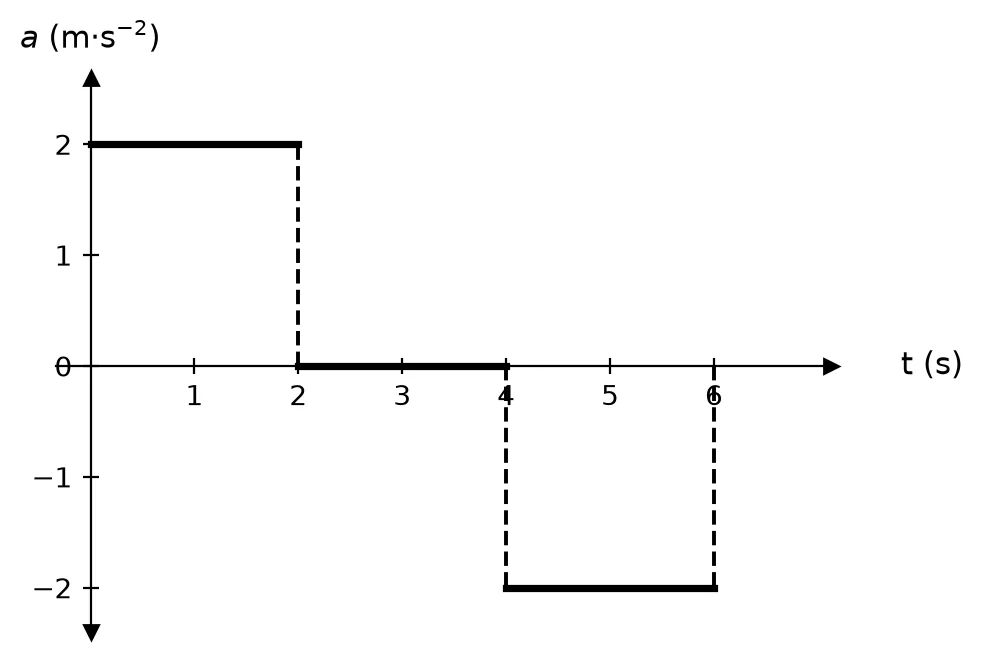 WE6 The acceleration vs. time graph for a car starting from rest, is given below. Calculate the velocity of the car and hence draw the velocity vs. time graph.(4)
Show the memo (4 ticks)Memo
- ✓Change in velocity 0 to 2 s m·s m·s
1 mark · Calculate from a motion graph
- ✓Change in velocity 2 to 4 s m·s m·s, so the velocity stays constant at m·s.
1 mark · Calculate from a motion graph
- ✓Change in velocity 4 to 6 s m·s m·s, so the velocity decreases from m·s to m·s at s.
1 mark · Calculate from a motion graph
- ✓Velocity vs. time graphStraight line from to m·s between and s; horizontal at m·s from s to s; straight line down to m·s at s.
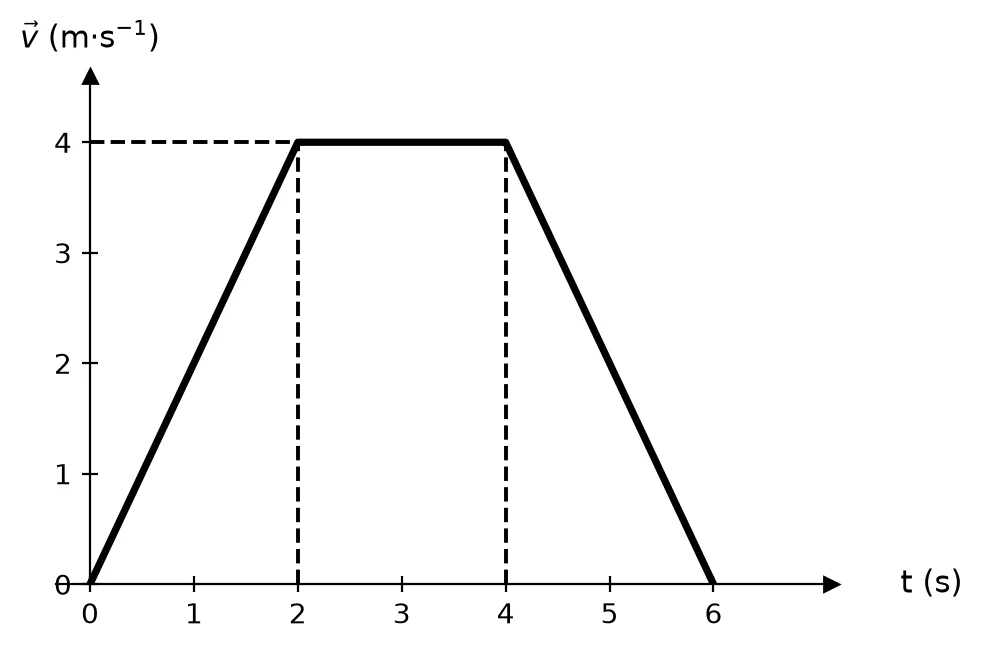
1 mark · Sketch motion graphs
- ✓
Free on Android
Know exactly which skill is costing you marks.
Mark past papers tick by tick in the NavyBlue app. It remembers every mark you lose, shows you the skills to fix first, and picks your next questions.
Get NavyBlue free on Google Play
