Grade 12 Physical Sciences · Chemical Change
Interpret equilibrium graphs
Read concentration-time or rate-time graphs to find when equilibrium is reached and which change was made at a given time.
- past paper questions use it
- 15 past paper questions use it
- videos
- 3 videos
Learn it: interpret equilibrium graphs
Pick one and watch it, then try the questions below. Videos load only when you tap play.
Now try it on a real exam question
No sign-up. Takes 3 minutes.
Question 6.5 · May/June 2025 · Paper 2 · National (DBE) · 2 marks
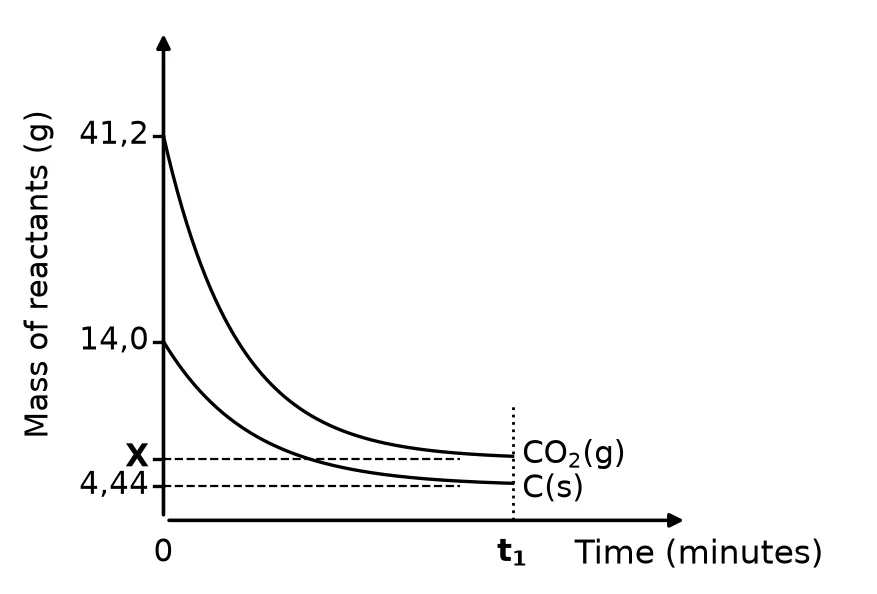
Equilibrium is reached at temperature T °C.
The graph below, not drawn to scale, shows the curves for the mass of the reactants in the container against time.
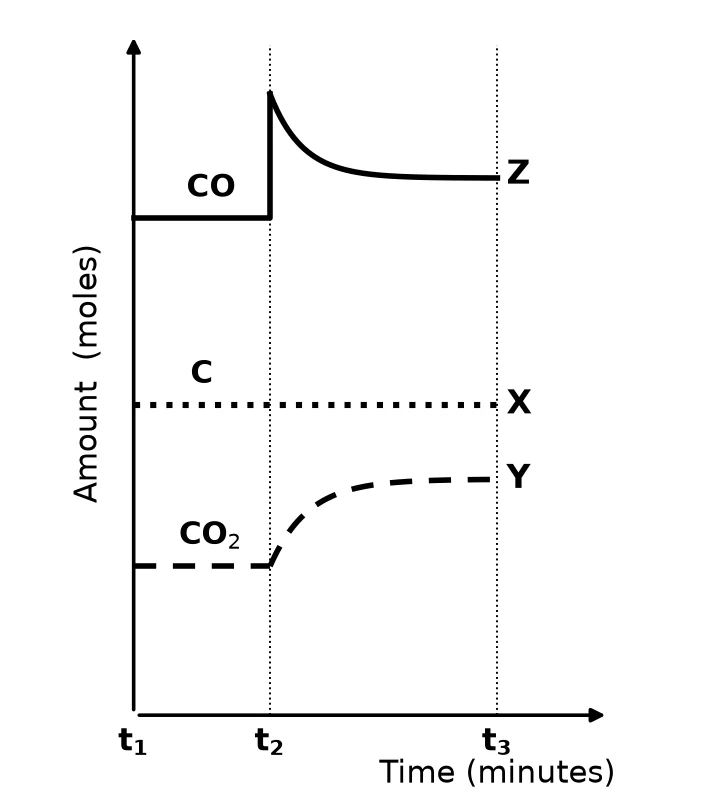
The graph below shows the equilibrium number of moles of CO(g), C(s) and CO(g) in the flask at time t.
A learner draws corresponding curves, labelled X and Y, for C(s) and CO(g) respectively.
Which of these curves is the CORRECT representation for these changes?
Choose from: X or Y or X and Y(2)
Work it out on paper first. Then mark yourself with the official memo, one tick at a time.
More past paper questions: interpret equilibrium graphs
Work each one out first, then open the memo and check every tick.
3. Question 6.6 · November 2023 · Paper 2 · National (DBE) · 3 marks
Consider the following hypothetical reaction reaching equilibrium in a dm closed container at °C.
The graph below shows the changes in the amounts of reactants and products over time.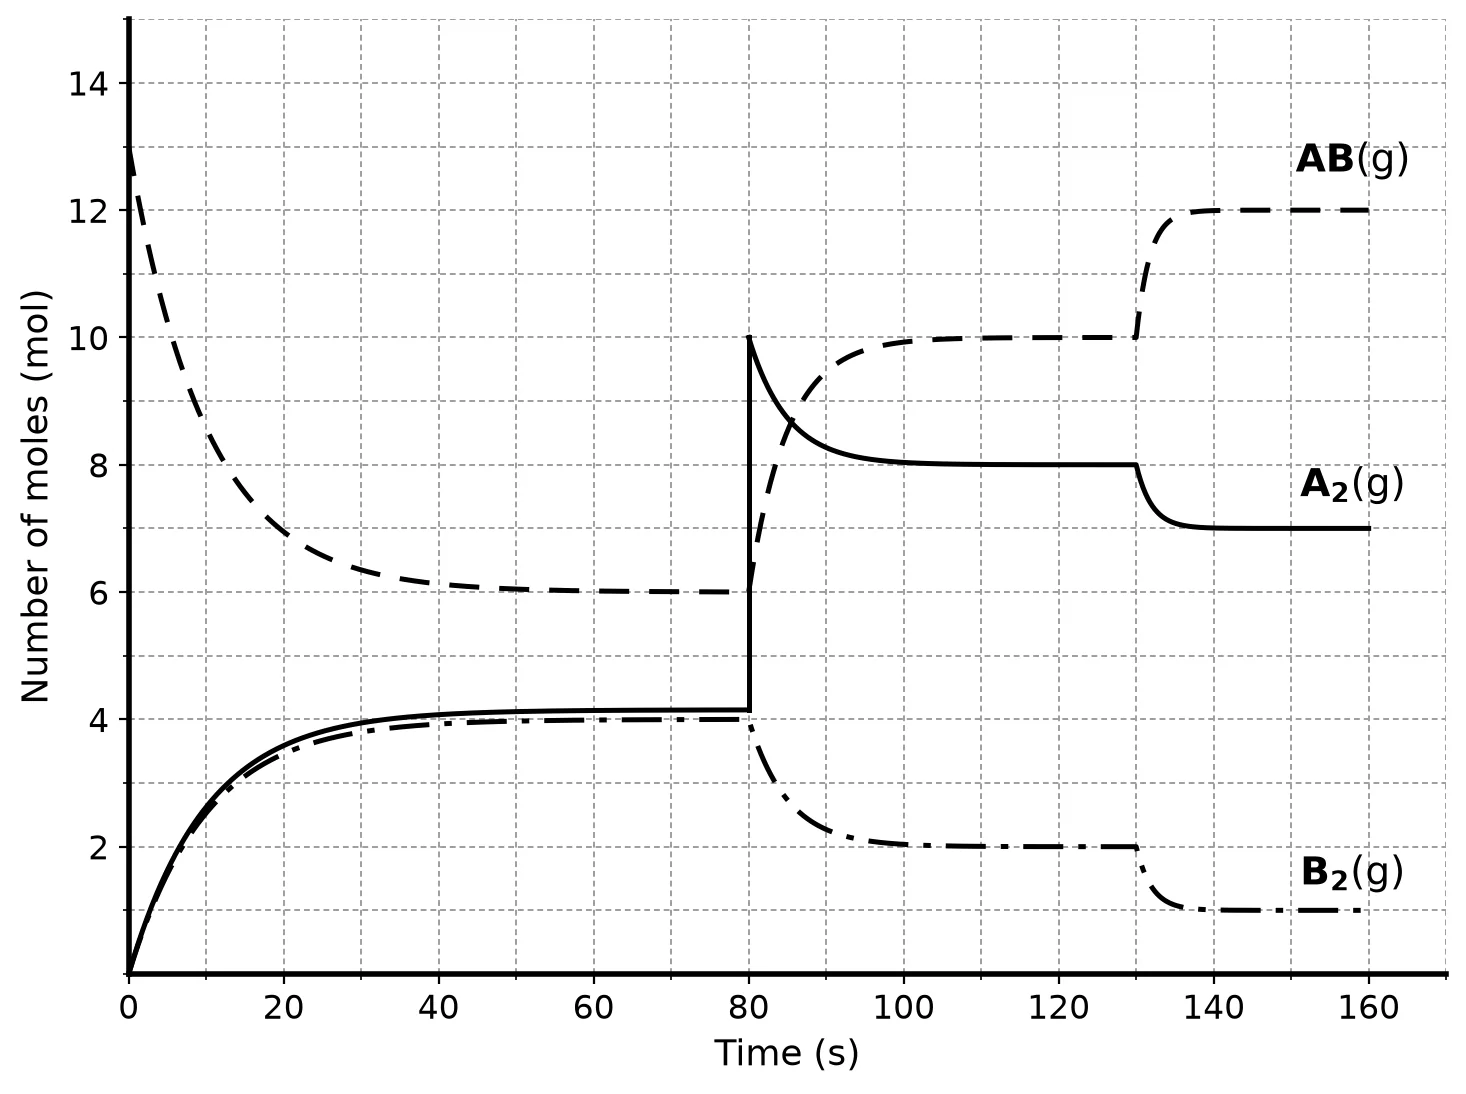 The initial reaction now takes place in the presence of a catalyst at °C.6.6 Describe the changes that will be observed on the graph between t = s and t = s.(3)
Show the memo (2 ticks)Memo
- ✓Gradients steeperGradients (of all three curves) will be steeper.
2 marks · Interpret equilibrium graphs
- ✓Same equilibrium valuesand reach the same equilibrium values (sooner).
1 mark · Interpret equilibrium graphs
- ✓
4. Question 6.1.2 · November 2024 · Paper 2 · National (DBE) · 1 mark
6.1 The reaction of carbon monoxide gas, CO(g), with oxygen gas, (g), is investigated. The reaction reaches equilibrium in a closed container at constant temperature T °C, according to the balanced equation:
Changes to the conditions of equilibrium are made at different times. The graph shows the results obtained. X, Y and Z represent the gases in the above reaction.
Answer the questions that follow.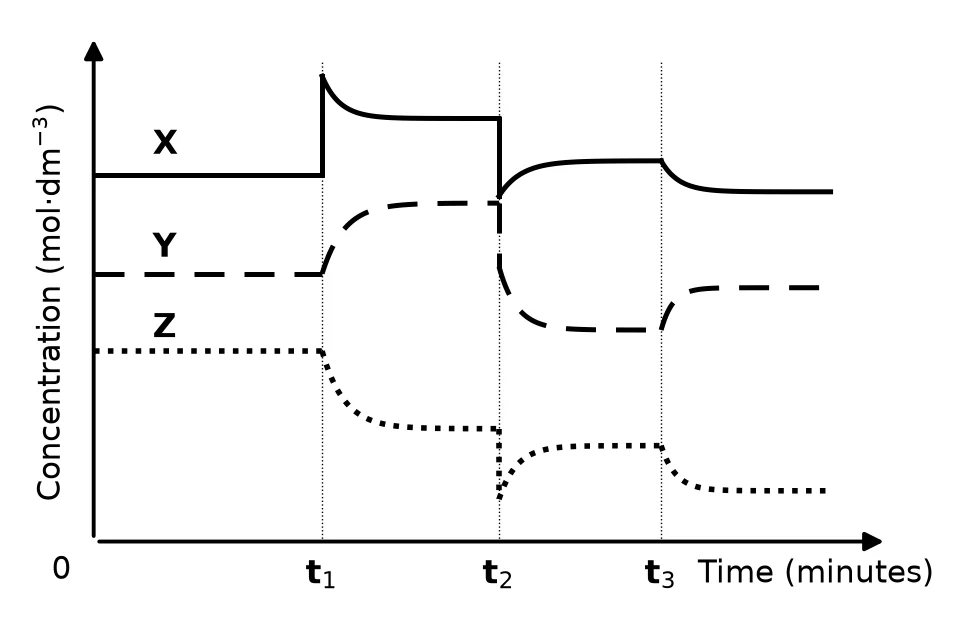 Use the graph to answer the questions below.6.1.2 At , oxygen, (g), was added to the container. Write down the letter that represents (g). Choose from X, Y or Z.(1)
Show the memo (1 tick)Memo
- ✓Letter for OX
1 mark · Interpret equilibrium graphs
- ✓
5. Question 6.7 · May/June 2024 · Paper 2 · National (DBE) · 1 mark
Consider the balanced equation for a hypothetical reaction that takes place in dm sealed containers.
The graphs below, not drawn to scale, are obtained for the same reaction at two different temperatures.
Graph A is obtained at K and graph B at K.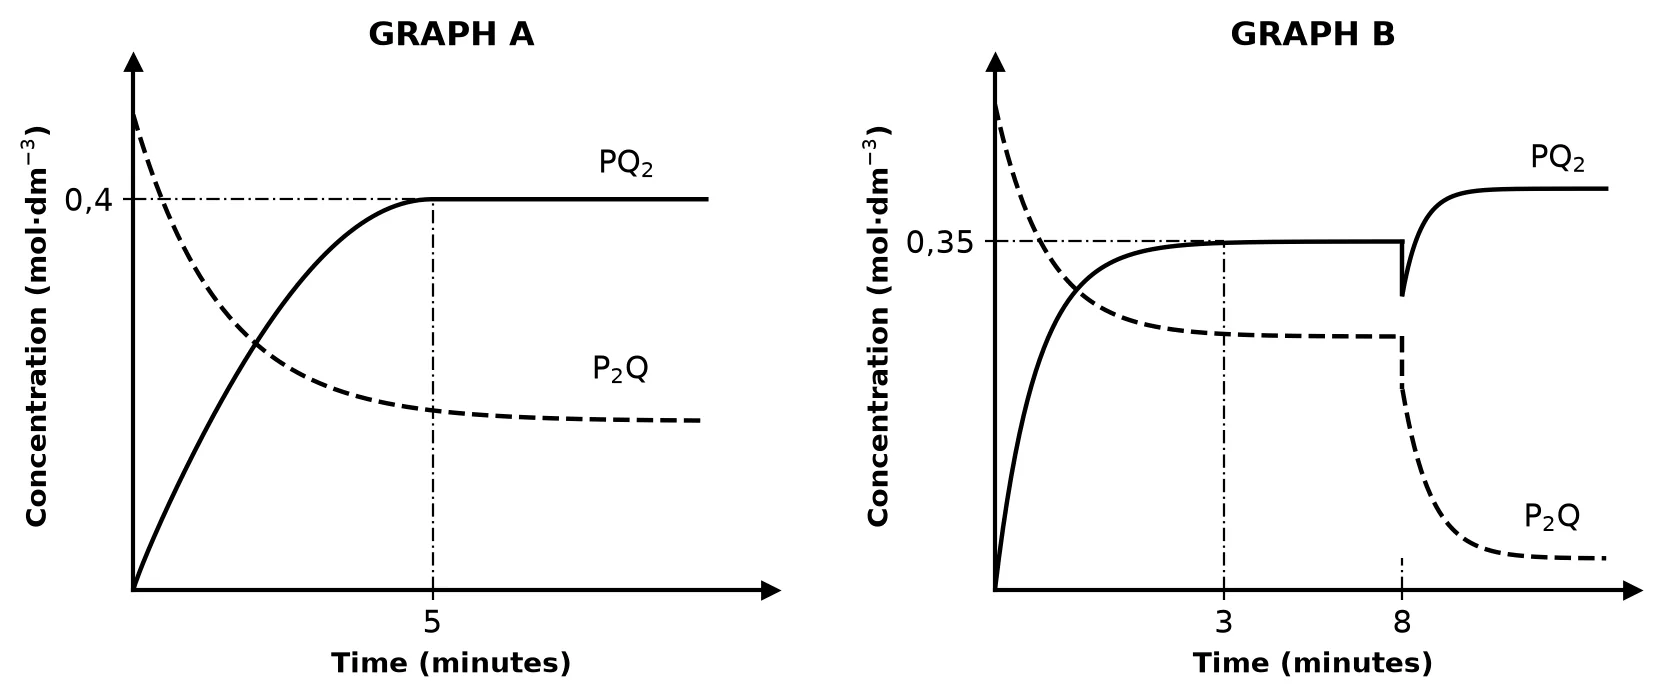 6.7 Describe the change made to the equilibrium system at t = 8 minutes, as shown in graph B, at a constant temperature.(1)
Show the memo (1 tick)Memo
- ✓Change madePressure was decreased / volume of the container was increased.
1 mark · Interpret equilibrium graphs
- ✓
6. Question 6.6.2 · November 2022 · Paper 2 · National (DBE) · 1 mark
Carbon, C(s), reacts with sulphur, S(g), according to the following balanced equation:
The system reaches equilibrium at temperature T in a sealed dm container.
The value is at temperature T.6.6 The reaction rate-time graph below represents further changes made to the equilibrium mixture. The volume of the container is kept constant.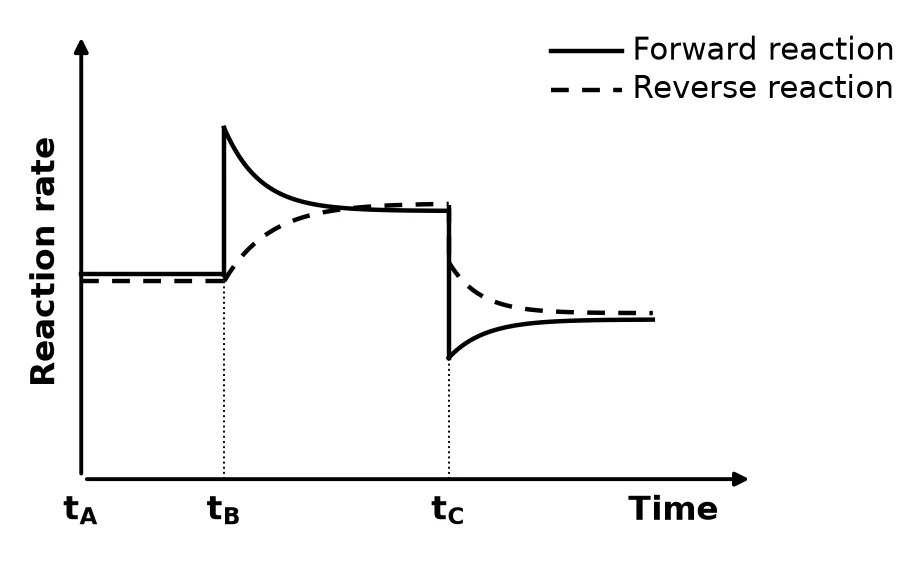 6.6.2 What change was made to the equilibrium mixture at ?(1)
Show the memo (1 tick)Memo
- ✓Change at tBIncrease in the amount/concentration of S/reactant OR S was added.
1 mark · Interpret equilibrium graphs
- ✓
Free on Android
Know exactly which skill is costing you marks.
Mark past papers tick by tick in the NavyBlue app. It remembers every mark you lose, shows you the skills to fix first, and picks your next questions.
Get NavyBlue free on Google Play
