Grade 12 Physical Sciences · Chemical Change
Sketch a Maxwell-Boltzmann curve
Sketch or read the curve of how many particles have each kinetic energy, and show how it shifts at a higher temperature.
- past paper questions use it
- 10 past paper questions use it
- videos
- 3 videos
Learn it: sketch a maxwell-boltzmann curve
Pick one and watch it, then try the questions below. Videos load only when you tap play.
Now try it on a real exam question
No sign-up. Takes 3 minutes.
Question 5.5 · November 2023 · Paper 2 · National (DBE) · 4 marks
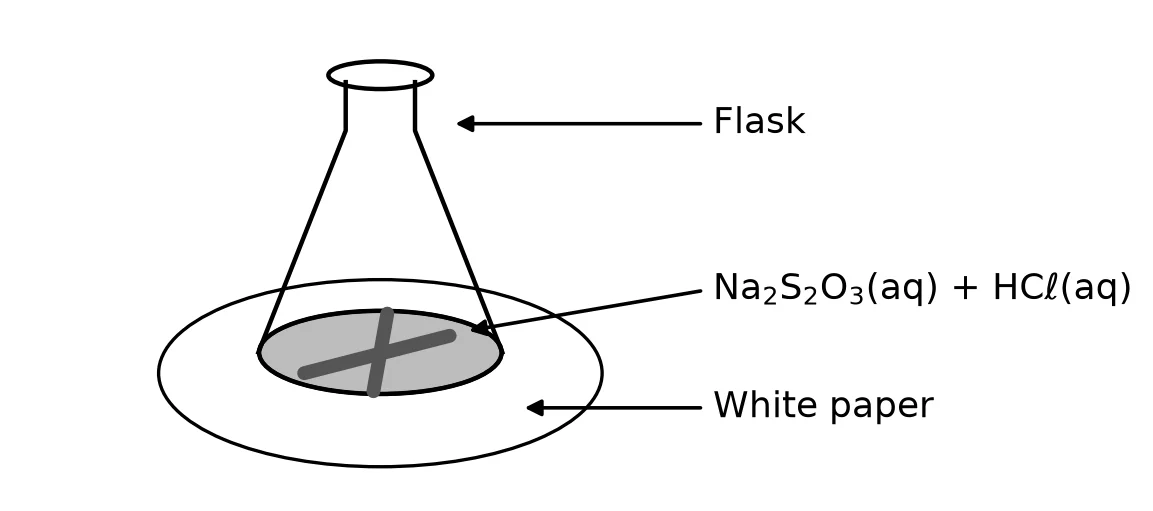
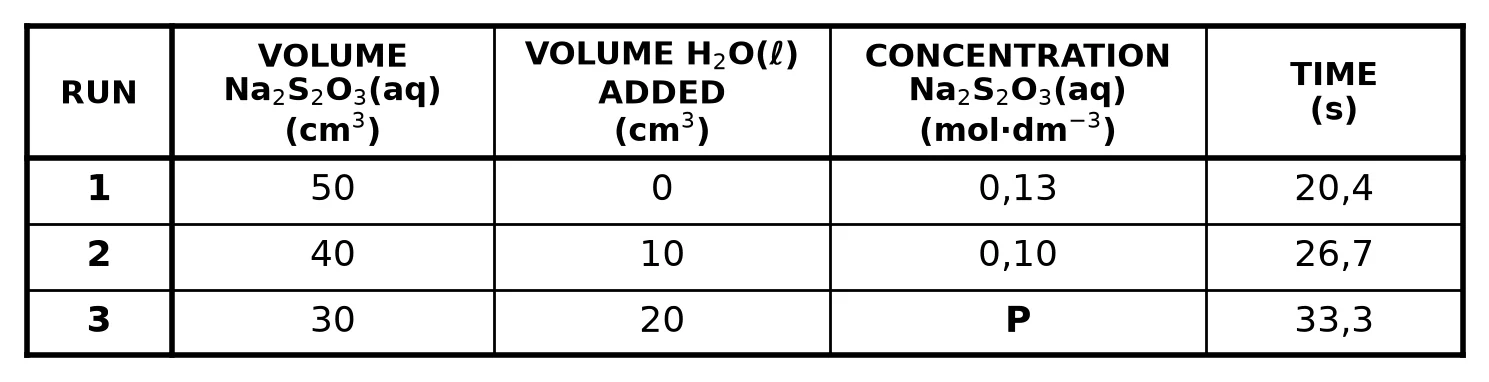
The concentration of HCl(aq) used is mol·dm. The same volume of HCl(aq) is used in each run.
The time taken for the cross on the paper under the flask to become invisible is measured.
The table below summarises the reaction conditions and results of the experiment.
Work it out on paper first. Then mark yourself with the official memo, one tick at a time.
More past paper questions: sketch a maxwell-boltzmann curve
Work each one out first, then open the memo and check every tick.
3. Question 5.3.5 · November 2025 · Paper 2 · National (DBE) · 2 marks
5.3 The reaction between sulphur dioxide, (g), and oxygen, (g), takes place in a sealed container according to the balanced equation below.
kJ·mol
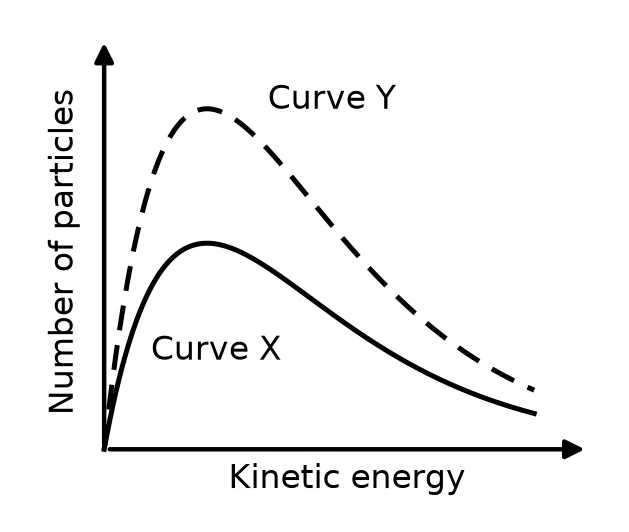
Answer the questions that follow.5.3.5 Redraw the above graph in the ANSWER BOOK. On the same set of axes, draw the curve that will now be obtained. Label this as curve Y.(2)Show the memo (2 ticks)Memo
- ✓Both curves start at origin, same shape, peaks at same EkBoth curves start at the origin and have the correct shape, with their peaks at the same kinetic energy.
1 mark · Sketch a Maxwell-Boltzmann curve
- ✓Peak of Y higher than X at the same EkPeak of curve Y must be higher than curve X with peaks at the same .
1 mark · Sketch a Maxwell-Boltzmann curve
- ✓
4. Question 5.4.1 · May/June 2023 · Paper 2 · National (DBE) · 2 marks
Consider the following decomposition reaction that takes place in a sealed dm container:
The graph below shows how the concentrations of (g) and (g) change with time.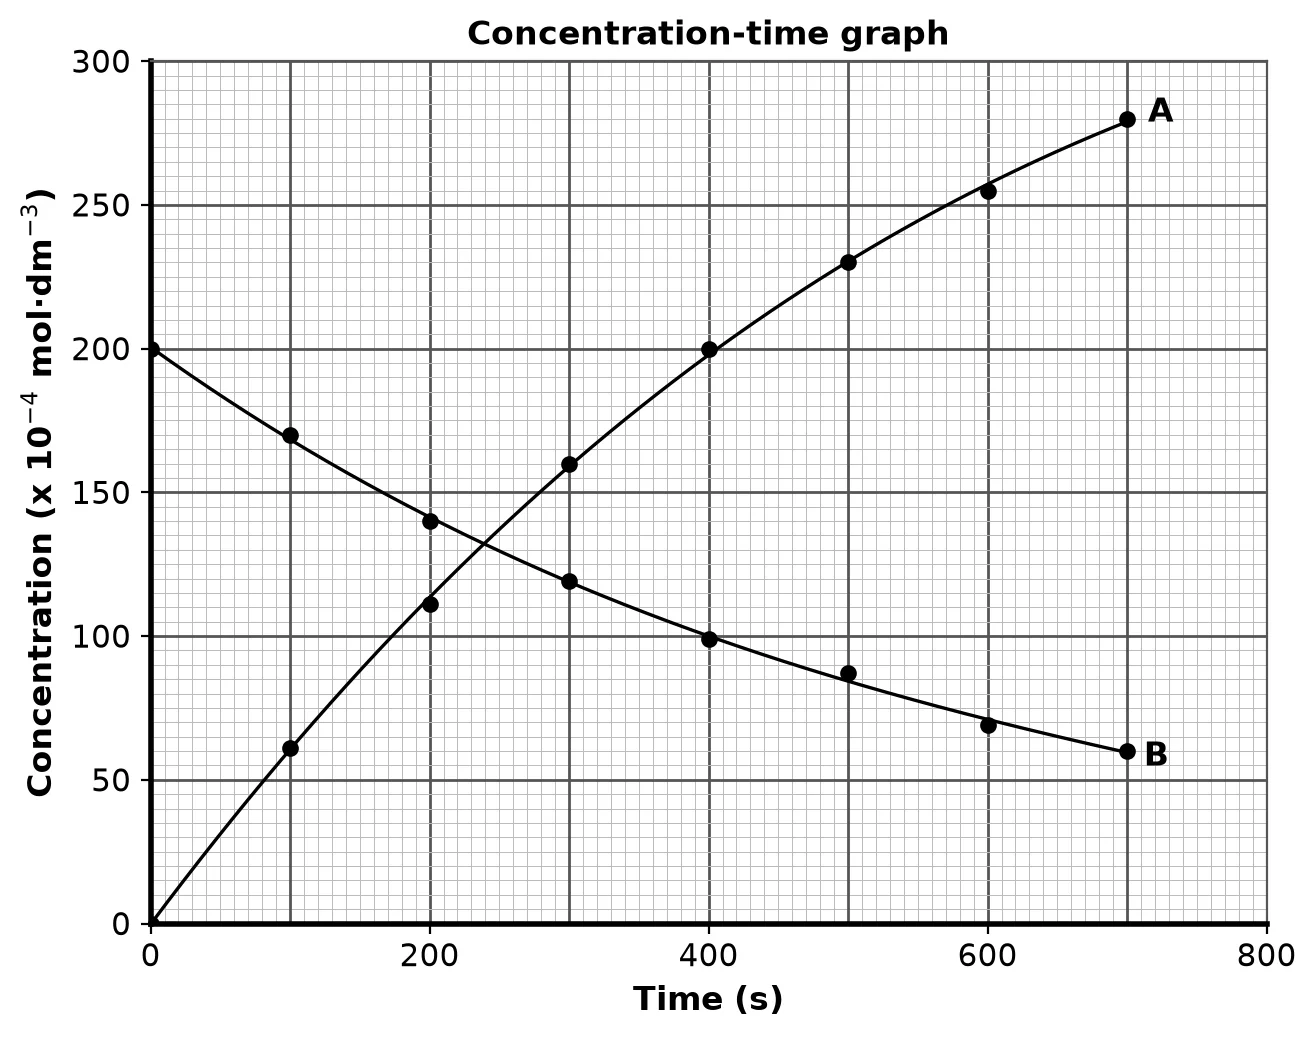 5.4 The Maxwell-Boltzmann distribution curve for the (g) initially present in the container is shown below.
The initial concentration of the (g) is now INCREASED.
Answer the questions that follow.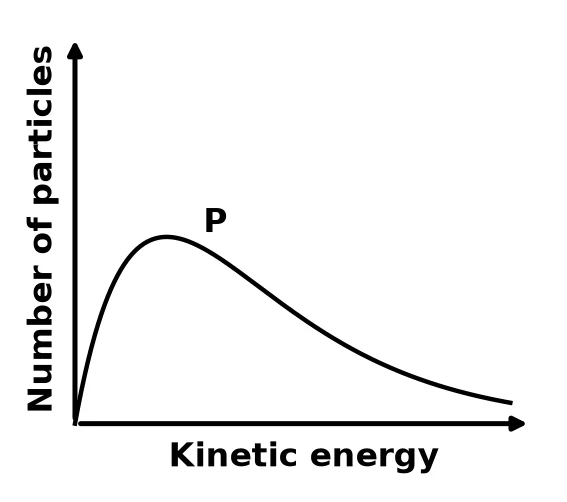 5.4.1 Redraw the distribution curve above in the ANSWER BOOK and label this curve as P.
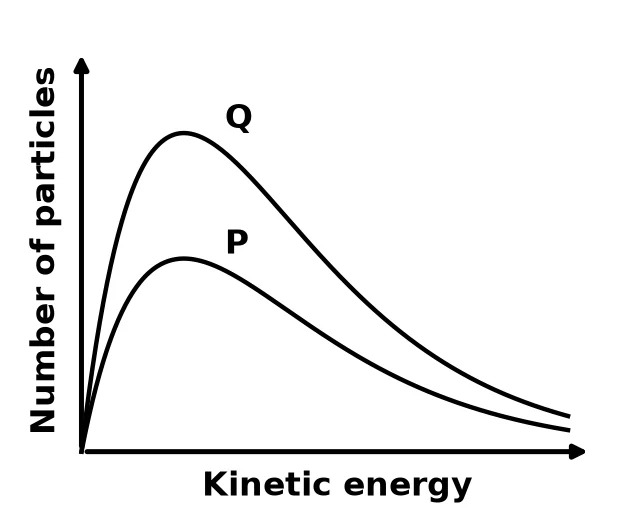
On the same set of axes, sketch the curve that will be obtained for the higher concentration of (g). Label this curve as Q.(2)Show the memo (2 ticks)Memo
- ✓Curve Q above P, same shape, peaks correspondCurve Q lies above the given curve P, has the same shape as P, and its peak is at the same kinetic energy as the peak of P.
1 mark · Sketch a Maxwell-Boltzmann curve
- ✓Starts at origin and does not cross PCurve Q starts at the origin and does not cross curve P.
1 mark · Sketch a Maxwell-Boltzmann curve
- ✓
5. Question 5.5 · May/June 2022 · Paper 2 · National (DBE) · 2 marks
Learners use the reaction of (s) with EXCESS dilute HC(aq) to investigate the relationship between temperature and the rate of a chemical reaction.
The balanced equation for the reaction is:
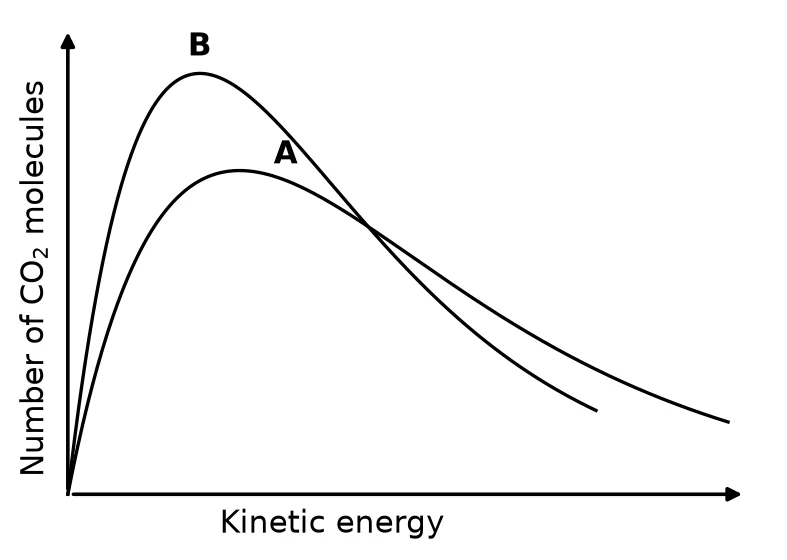
The results obtained are represented in the graph below.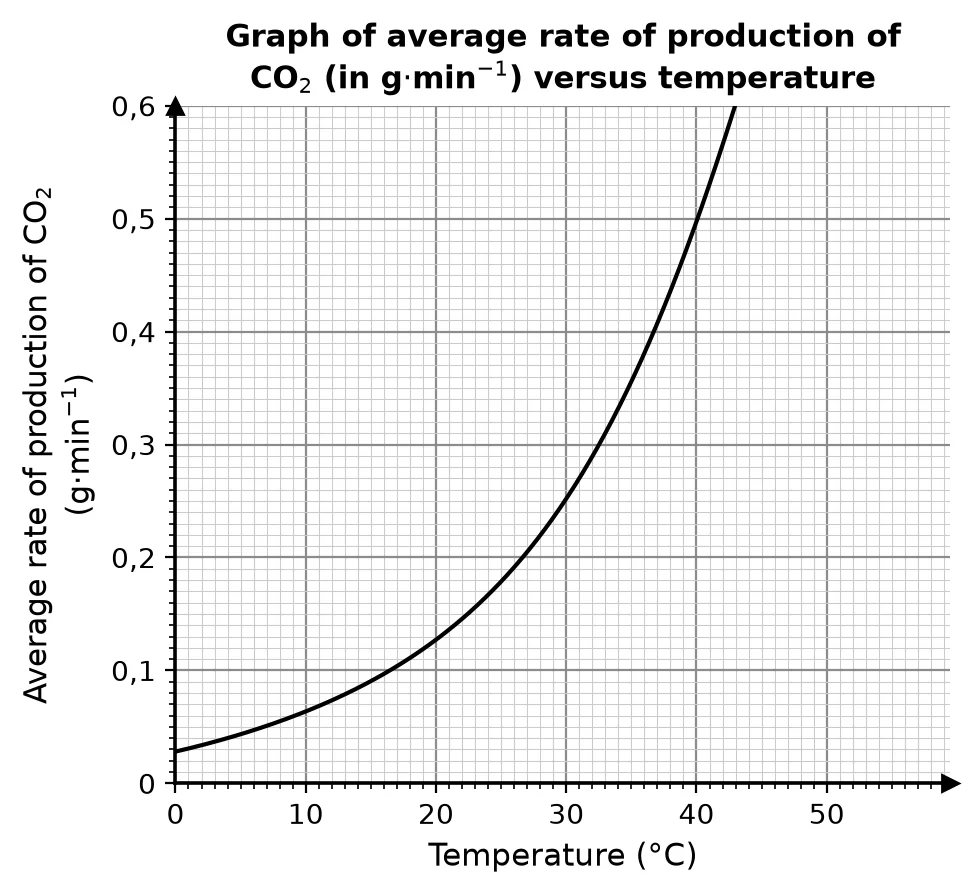 The graph below represents the Maxwell-Boltzmann distribution curve for (g) at °C.
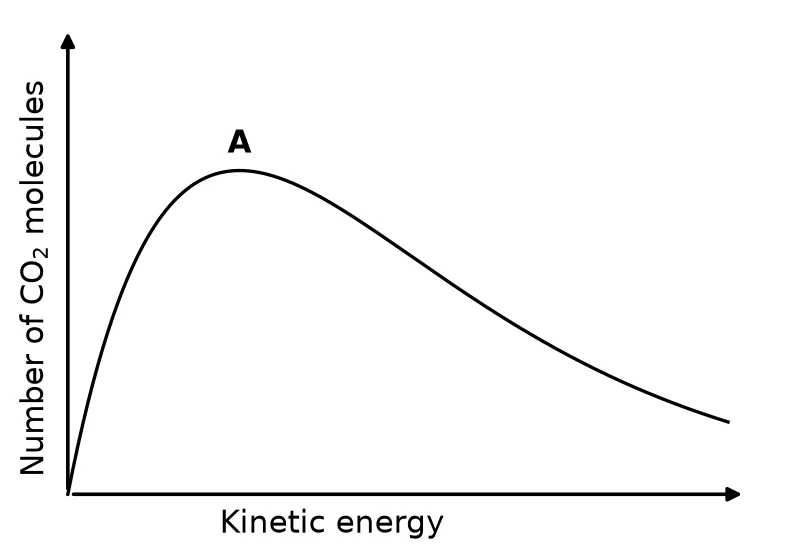 5.5 Redraw the graph above in the ANSWER BOOK. Clearly label the curve as A.
On the same set of axes, sketch the curve that will be obtained for the (g) at °C. Label this curve as B.(2)Show the memo (2 ticks)Memo
- ✓Higher peak to the leftCurve B has a higher peak to the left of curve A.
1 mark · Sketch a Maxwell-Boltzmann curve
- ✓Below A beyond the peakCurve B is below curve A beyond the peak of curve A.
1 mark · Sketch a Maxwell-Boltzmann curve
- ✓
6. Question 5.2.1 · November 2024 · Paper 2 · National (DBE) · 1 mark
5.2 Curve X is the Maxwell Boltzmann distribution curve for a reaction under a set of reaction conditions. A change was made to one of the reaction conditions to obtain curve Y.
Answer the questions that follow.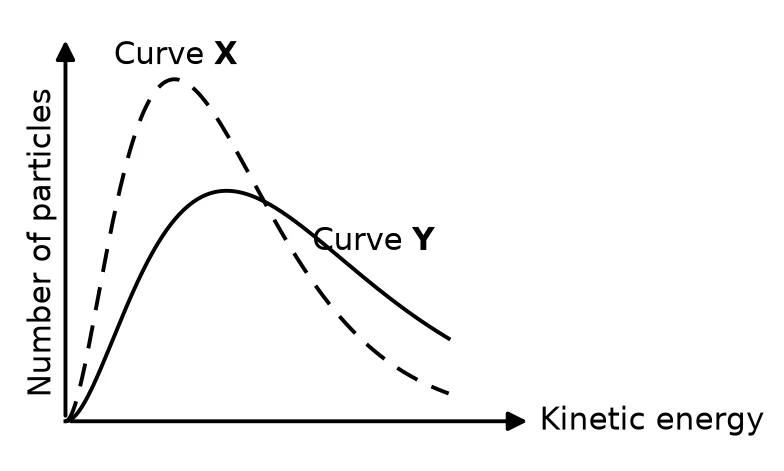 5.2.1 What change was made to obtain curve Y?(1)
Show the memo (1 tick)Memo
- ✓Change madeAn increase in temperature.
1 mark · Sketch a Maxwell-Boltzmann curve
- ✓
Free on Android
Know exactly which skill is costing you marks.
Mark past papers tick by tick in the NavyBlue app. It remembers every mark you lose, shows you the skills to fix first, and picks your next questions.
Get NavyBlue free on Google Play
