Grade 10 Maths · Statistics · Draw and read a stem-and-leaf plot
Draw and read a stem-and-leaf plot Grade 10
Draw a single or back-to-back stem-and-leaf plot and read values, the median or the range from it, for example a stem of 4 with a leaf of 7 means 47.
- practice questions use it, all grades
- 17 practice questions use it, all grades
- videos
- 3 videos
Learn it: draw and read a stem-and-leaf plot
Pick one and watch it, then try the questions below. Videos load only when you tap play.
Now try it on a question
No sign-up. Takes 3 minutes.
Practice · NavyBlue · 2 marks
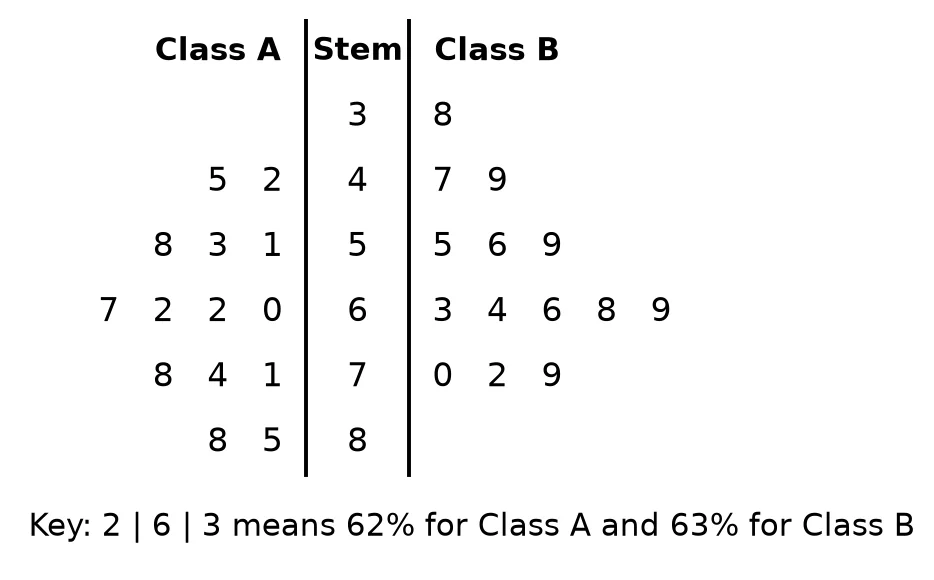
Work it out on paper first. Then mark yourself with the memo, one tick at a time.
More questions: draw and read a stem-and-leaf plot
Work each one out first, then open the memo and check every tick.
3. Practice · NavyBlue · 3 marks
The number of push-ups done in one minute by boys and girls:
Boys:
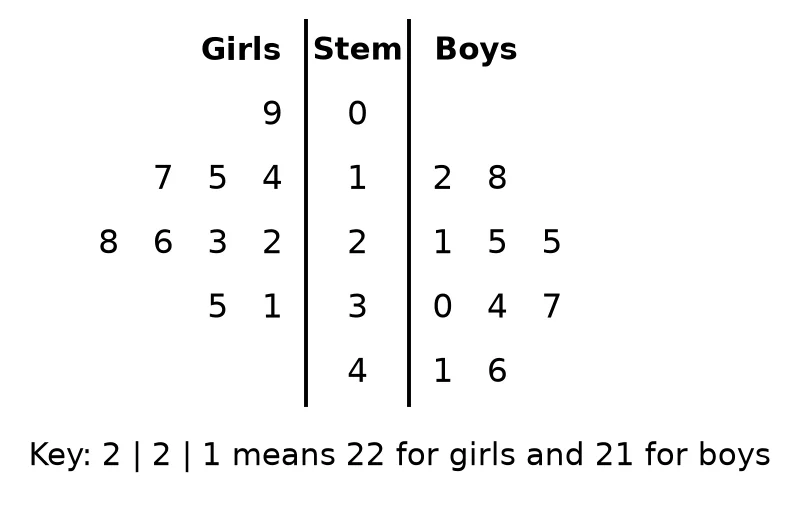
Girls:Draw a back-to-back stem-and-leaf plot of the data, with the girls on the left. Include a key.(3)Show the memo (3 ticks)Memo
- ✓Common stemsStems in the middle
1 mark · Draw and read a stem-and-leaf plot
- ✓Leaves on both sidesGirls (left, read outwards): ; ; ;
Boys (right): ; ; ;1 mark · Draw and read a stem-and-leaf plot
- ✓KeyKey: means for girls and for boys
1 mark · Draw and read a stem-and-leaf plot
- ✓
4. Practice · NavyBlue · 2 marks
The distances (in metres) jumped by athletes in a long jump event are shown below.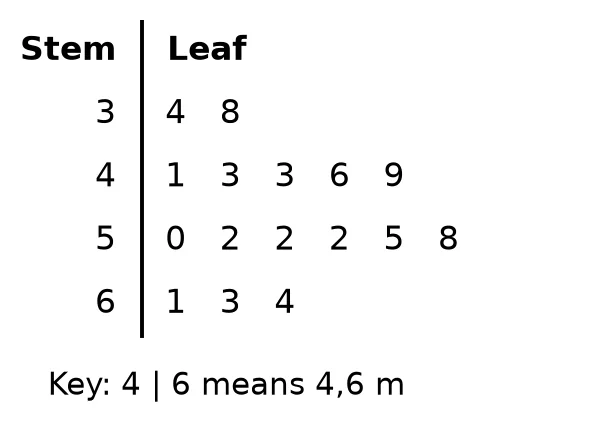 What percentage of the athletes jumped further than m?(2)
Show the memo (2 ticks)Memo
- ✓Count: athletes
1 mark · Draw and read a stem-and-leaf plot
- ✓Percentage
1 mark · Calculate with percentages
- ✓
5. Practice · NavyBlue · 2 marks
The heights (in cm) of Grade 10 learners are shown in the stem-and-leaf plot.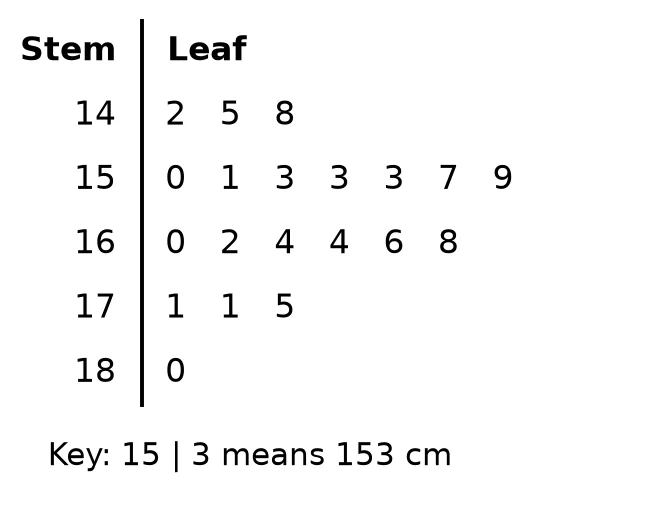 Determine the median height.(2)
Show the memo (2 ticks)Memo
- ✓Position of the median, so the median lies between the th and th values: and
1 mark · Draw and read a stem-and-leaf plot
- ✓Median cm
1 mark · Find the median
- ✓
6. Practice · NavyBlue · 3 marks
The waiting times (in minutes) of patients at a clinic one morning are shown in the stem-and-leaf plot.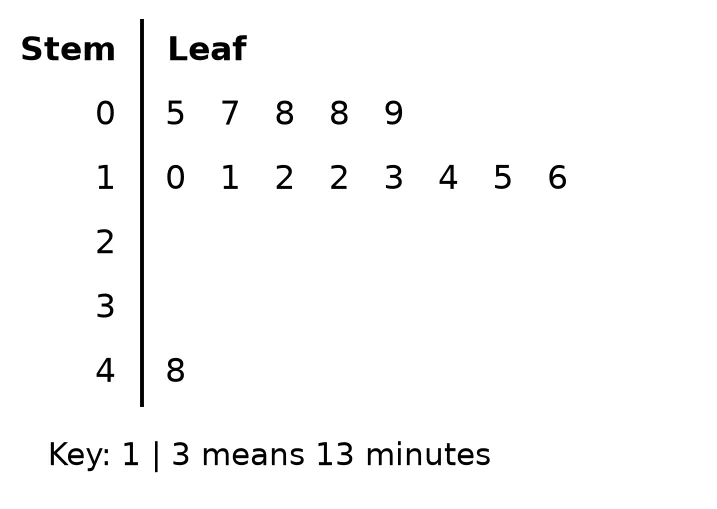 Calculate the mean and the median waiting time.(3)
Show the memo (3 ticks)Memo
- ✓Values read from the plot
1 mark · Draw and read a stem-and-leaf plot
- ✓Mean minutes
1 mark · Calculate the mean
- ✓Median minutes
1 mark · Find the median
- ✓
Free on Android
Know exactly which skill is costing you marks.
Mark past papers tick by tick in the NavyBlue app. It remembers every mark you lose, shows you the skills to fix first, and picks your next questions.
Get NavyBlue free on Google Play