Grade 11 Maths · Statistics · Paper 2
Ogives Grade 11
Real Ogives past paper questions and answers from 2023 to 2025, with each memo split into the ticks examiners give. Try one, mark yourself, and see exactly which skill cost you marks.
- past paper questions
- 16 past paper questions
- skills
- 4 skills
- videos
- 4 videos
Try a Ogives exam question
No sign-up. Takes 3 minutes.
Question 2.3 · November 2025 · Paper 2 · Provincial · 2 marks
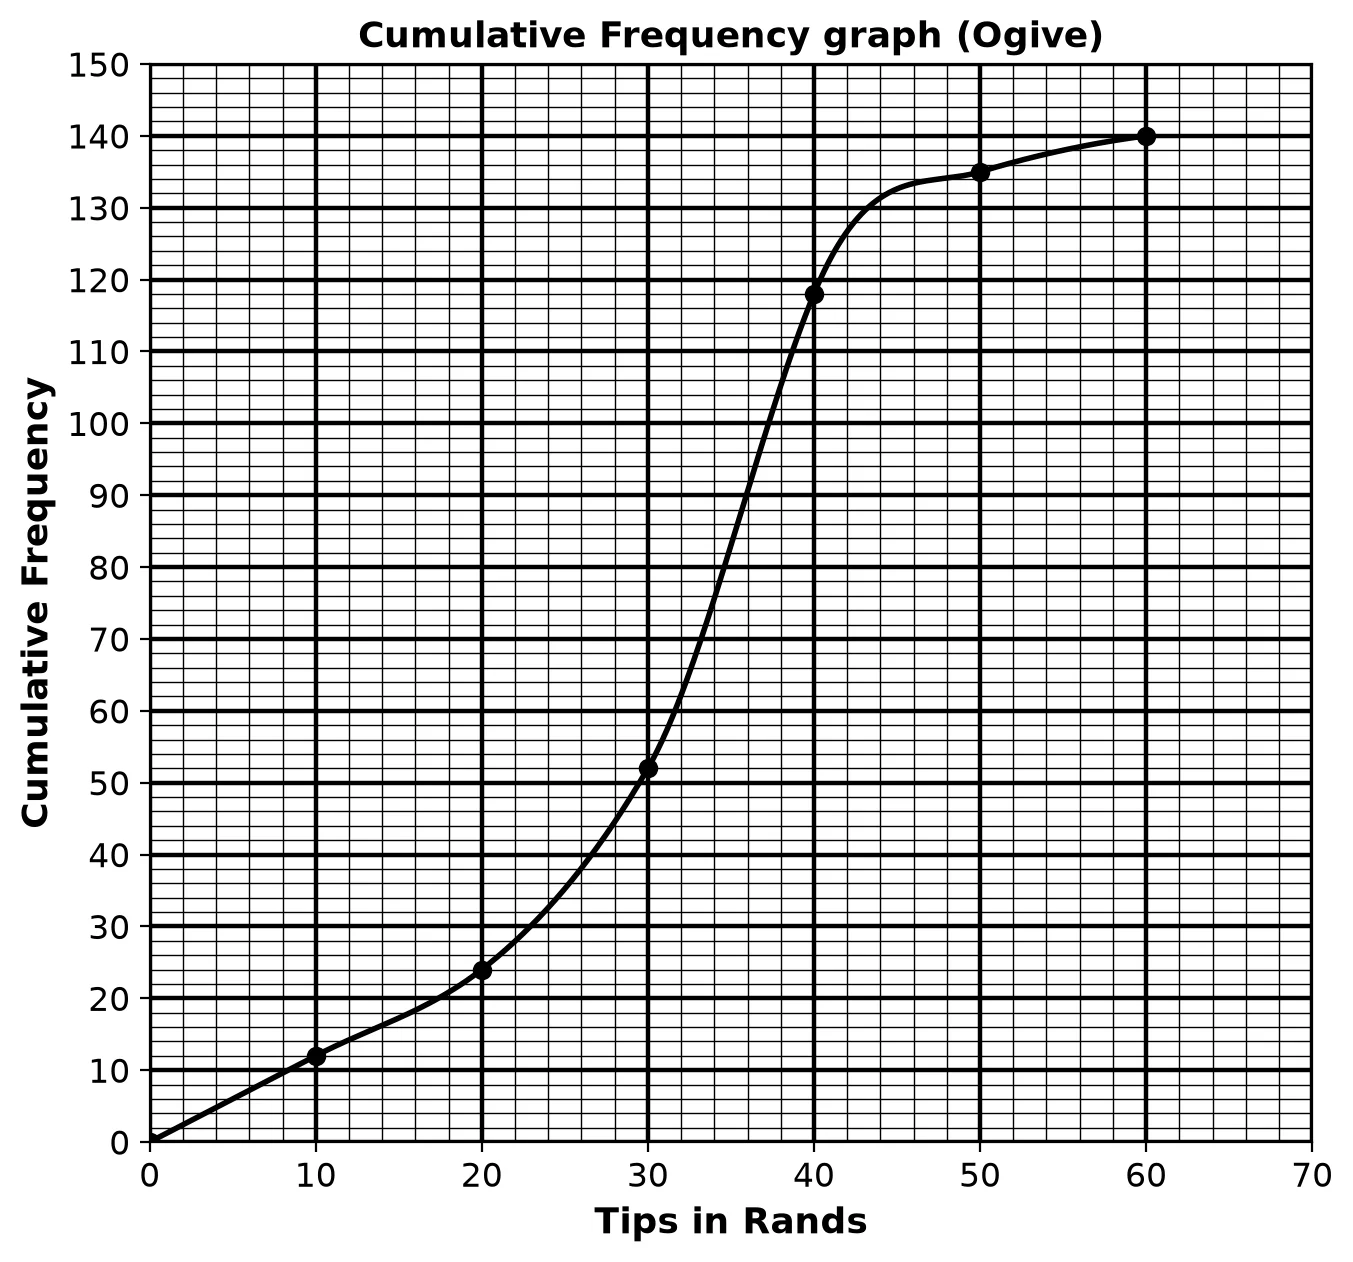
Work it out on paper first. Then mark yourself with the official memo, one tick at a time.
Ogives skills
Each skill is one thing a memo gives a tick for. Tap one for its own questions, notes and videos.
- Read and complete a frequency tableRead and fill in a frequency table, for example find a missing count or how many learners scored below 50.15 past paper questions · 3 videos
- Draw a histogram, polygon or ogiveDraw a histogram, frequency polygon or ogive from a frequency table, with correct scales, labels and heights.6 past paper questions · 3 videos
- Read values from an ogiveRead values off an ogive (cumulative frequency curve), for example the median, or how many learners scored less than 60.7 past paper questions · 3 videos
- Draw an ogiveDraw an ogive by plotting each cumulative frequency at the upper end of its class and joining the points with a smooth curve.3 past paper questions · 3 videos
More Ogives Grade 11 questions and answers
Try each one on paper before you open the memo.
4. Question 9.2.1 · November 2023 · Paper 1 · Provincial · 3 marks
9.2 A cellphone distribution company investigated the number of defective phones that they obtain from two suppliers, Axis Phones and Direct Phones. They recorded their findings in a contingency table, shown below.
Answer the questions that follow.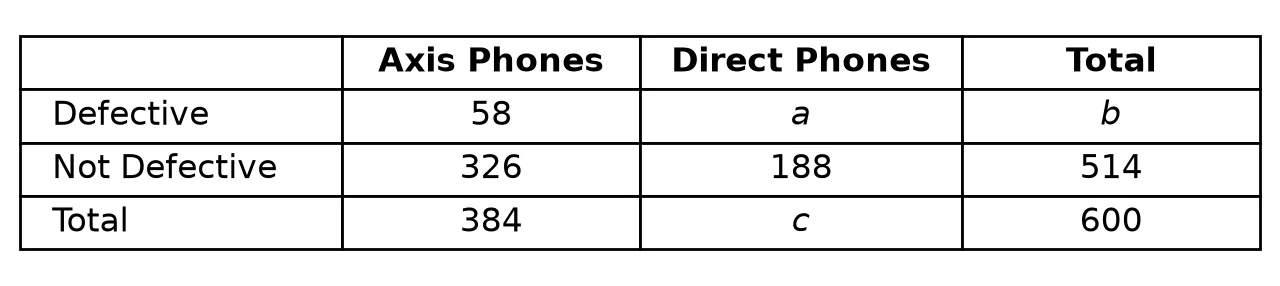 9.2.1 Determine the values of , and .(3)
Show the memo (3 ticks)Memo
- ✓
1 mark · Read and complete a frequency table
- ✓
1 mark · Read and complete a frequency table
- ✓
1 mark · Read and complete a frequency table
- ✓
5. Question b · Siyavula Grade 11 Mathematics, 11.3 Ogives, Worked example 8 · 3 marks
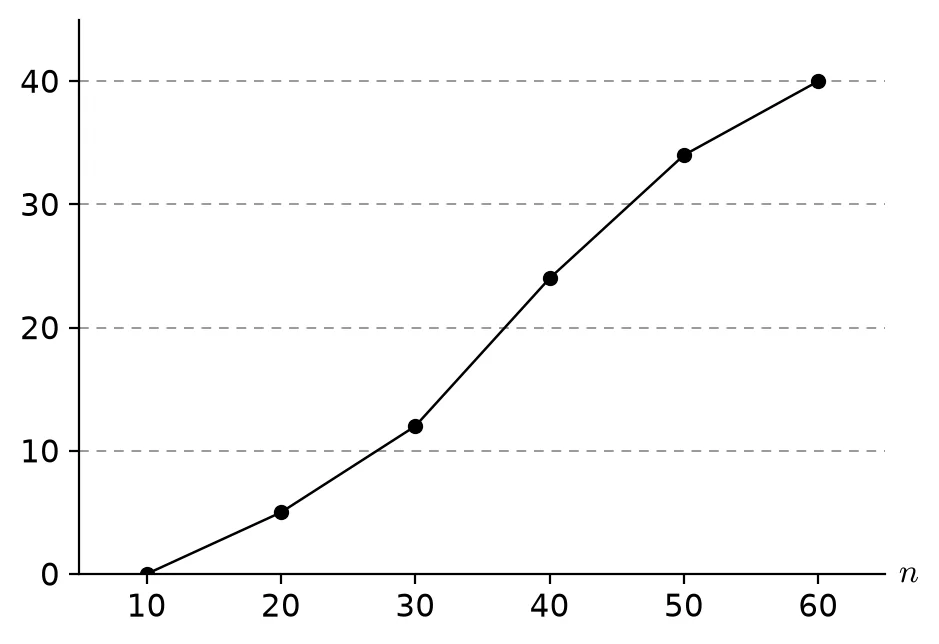
The grouped data below is given in a table.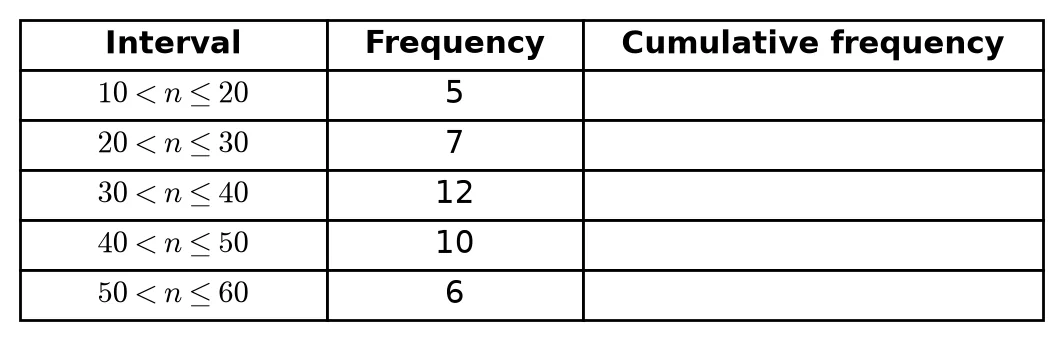 b Use the table to draw an ogive of the data.(3)
Show the memo (3 ticks)Memo
- ✓Grounded at the startThe first point is : at the beginning of the first interval, with a count of .
1 mark · Draw an ogive
- ✓Points at the upper limitsPlot each cumulative frequency at the end of its interval: , , , , .
1 mark · Draw an ogive
- ✓Points joinedConnect the points to give the ogive.
1 mark · Draw an ogive
- ✓
6. Question WE9 · Siyavula Grade 11 Mathematics, 11.3 Ogives, Worked example 9 · 5 marks
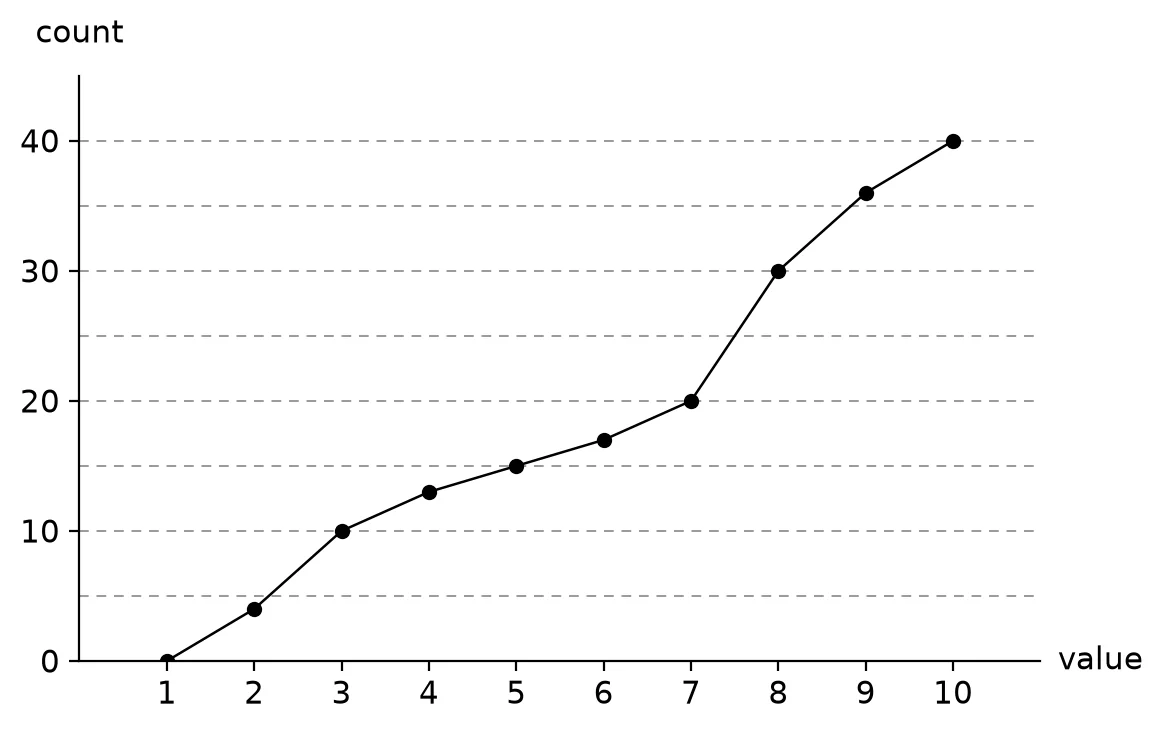 WE9 Use the following ogive to compute the five number summary of the data. Remember that the five number summary consists of the minimum, all the quartiles (including the median) and the maximum.(5)
Show the memo (5 ticks)Memo
- ✓MinimumThe minimum value is , since this is where the ogive starts on the horizontal axis.
1 mark · Read values from an ogive
- ✓MaximumThe maximum value is , since this is where the ogive stops on the horizontal axis.
1 mark · Read values from an ogive
- ✓First quartileThe counts go up to , so is at a count of :
1 mark · Read values from an ogive
- ✓MedianA count of corresponds to a value of : median
1 mark · Read values from an ogive
- ✓Third quartile and summaryA count of corresponds to a value of :
The five number summary is .1 mark · Read values from an ogive
- ✓
Ogives Grade 11 videos
Short lessons from South African teachers first. Videos load only when you tap play, to save your data.
Free on Android
Know exactly which skill is costing you marks.
Mark past papers tick by tick in the NavyBlue app. It remembers every mark you lose, shows you the skills to fix first, and picks your next questions.
Get NavyBlue free on Google Play
