Grade 10 Maths · Statistics · Paper 2
Measures of Central Tendency Grade 10
Real Measures of Central Tendency past paper questions and answers from 2024 to 2025, with each memo split into the ticks examiners give. Try one, mark yourself, and see exactly which skill cost you marks.
- past paper questions
- 31 past paper questions
- skills
- 6 skills
- videos
- 6 videos
Try a Measures of Central Tendency exam question
No sign-up. Takes 3 minutes.
Question 1.1 · May/June 2025 · Paper 2 · National (DBE) · 2 marks
134, 215, 325, 326, 362, 429, 515, 531, 598, 610, 624, 728, 923, 1034, 1200
Work it out on paper first. Then mark yourself with the official memo, one tick at a time.
Measures of Central Tendency skills
Each skill is one thing a memo gives a tick for. Tap one for its own questions, notes and videos.
- Find the medianPut the data in order and find the middle value (for example the median of 2, 5, 7, 9 is 6, the mean of 5 and 7).10 past paper questions · 3 videos
- Calculate the meanFind the average by adding all the values and dividing by how many there are (for example (4 + 6 + 8) ÷ 3 = 6).13 past paper questions · 3 videos
- Find the mode or modal classFind the value that appears most often, or the group with the highest frequency, for example the mode of 2, 3, 3, 5 is 3.5 past paper questions · 3 videos
- Interpret data and draw conclusionsExplain what data shows in real life, for example compare two classes' results or say whether a graph is misleading.4 past paper questions · 4 videos
- Estimate the mean of grouped dataEstimate the mean of grouped data by multiplying each class midpoint by its frequency, adding, and dividing by the total frequency.4 past paper questions · 4 videos
- Find the median or quartile intervalFind which class interval holds the median or a quartile in grouped data, for example the 20th value of 40 lies in 30 ≤ x < 40.5 past paper questions · 3 videos
More Measures of Central Tendency Grade 10 questions and answers
Try each one on paper before you open the memo.
4. Question 5.2.1 · September 2024 · Provincial · 2 marks
The following Life Sciences marks, for a test out of 50, were recorded from 15 grade 10 learners at a certain school. 5.2 Determine:5.2.1 The mean of the data.(2)
Show the memo (2 ticks)Memo
- ✓
1 mark · Calculate the mean
- ✓Answer
1 mark · Calculate the mean
- ✓
5. Question 2.3 · November 2024 · Paper 2 · Provincial · 4 marks
The histogram below shows the distribution of examination scores for learners in Introductory stats.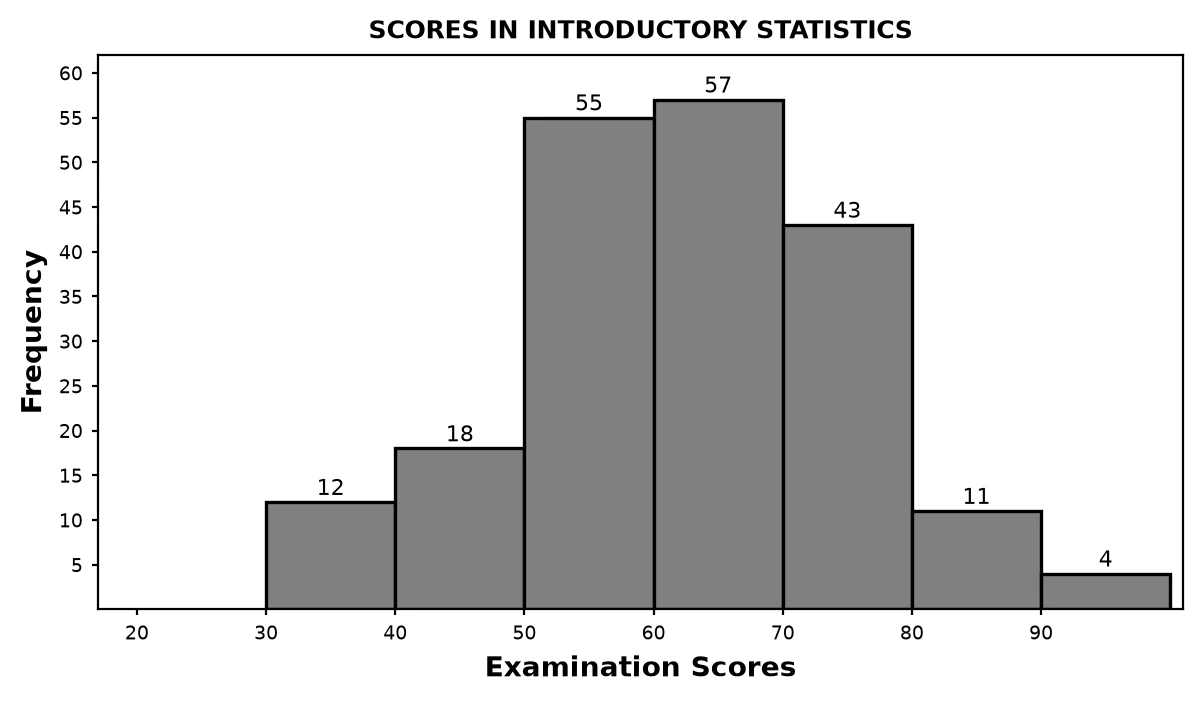 2.3 Estimate the mean of this data. Show all calculations.(4)
Show the memo (4 ticks)Memo
- ✓Add the frequencies
1 mark · Estimate the mean of grouped data
- ✓Sum of midpoint × frequencyMidpoints |
1 mark · Estimate the mean of grouped data
- ✓Substitution
1 mark · Estimate the mean of grouped data
- ✓Answer
1 mark · Estimate the mean of grouped data
- ✓
6. Question 1.3 · November 2024 · Paper 2 · Provincial · 2 marks
After utilising GeoGebra to teach geometry, the 14 participants marks out of 100 are displayed in the table below.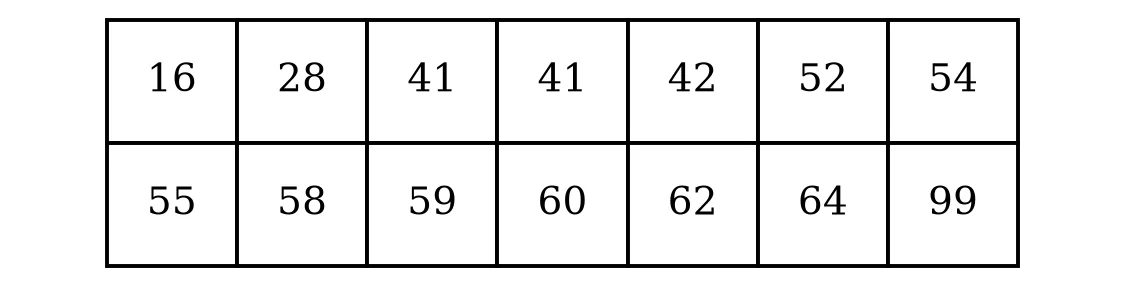 1.3 Determine the median of the data.(2)
Show the memo (2 ticks)Memo
- ✓Dividing a sum by 2Median
1 mark · Find the median
- ✓AnswerMedian
1 mark · Find the median
- ✓
7. Question 2.3 · November 2024 · Paper 2 · Provincial · 3 marks
The weight of the boxers who underwent fitness and health checks is shown in the frequency table below.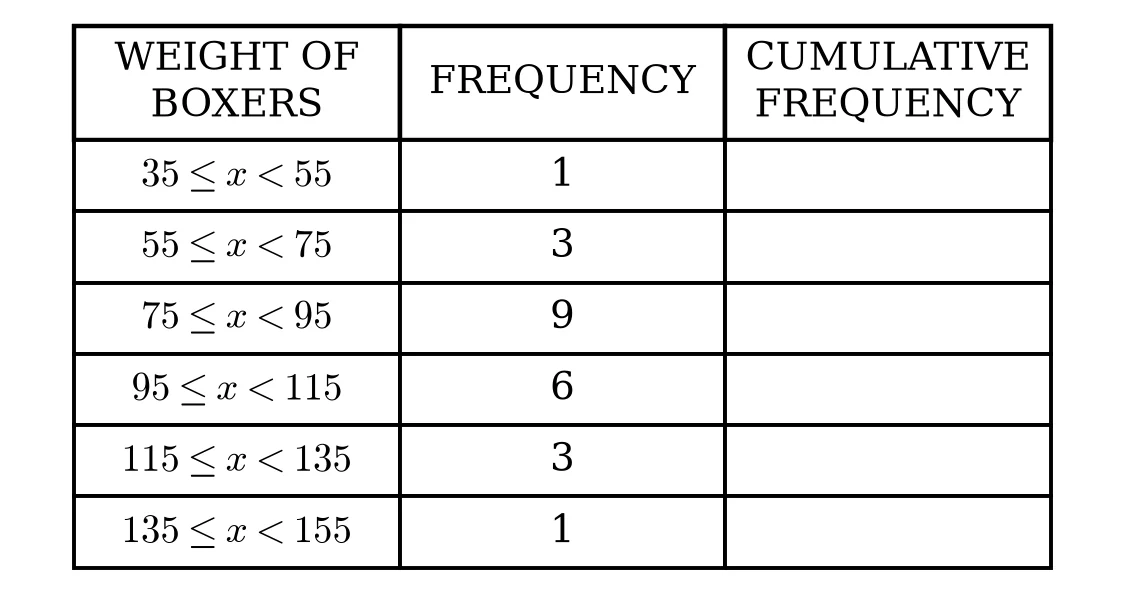 2.3 Estimate the mean for the data.(3)
Show the memo (3 ticks)Memo
- ✓
1 mark · Estimate the mean of grouped data
- ✓2 155
1 mark · Estimate the mean of grouped data
- ✓Answer
1 mark · Estimate the mean of grouped data
- ✓
8. Question 1.1 · November 2024 · Paper 2 · Provincial · 2 marks
The traffic department set up a roadblock on the N12 between Potchefstroom and Klerksdorp. During the first hour, they stopped 11 minibus taxis.
The following dataset is a summary of the number of passengers per minibus taxi.
18, 26, 25, 18, 16, 12, 10, 8, 18, 17, 81.1 Calculate the mean number of passengers per taxi.(2)Show the memo (2 ticks)Memo
- ✓Sum of the dataMean
1 mark · Calculate the mean
- ✓Answer
1 mark · Calculate the mean
- ✓
9. Question WE4 · Siyavula Grade 10 Mathematics, 10.2 Measures of central tendency, Worked example 4 · 2 marks
WE4 What is the median of ?(2)Show the memo (2 ticks)Memo
- ✓Sort the values
1 mark · Find the median
- ✓MedianThere are values, an odd number, so the median is the value in the fourth position.
Median1 mark · Find the median
- ✓
10. Question WE5 · Siyavula Grade 10 Mathematics, 10.2 Measures of central tendency, Worked example 5 · 2 marks
WE5 What is the median of ?(2)Show the memo (2 ticks)Memo
- ✓Sort the values
1 mark · Find the median
- ✓MedianThere are values, an even number, so the median is halfway between the fourth and fifth values, and .
Median1 mark · Find the median
- ✓
Measures of Central Tendency Grade 10 videos
Short lessons from South African teachers first. Videos load only when you tap play, to save your data.
Free on Android
Know exactly which skill is costing you marks.
Mark past papers tick by tick in the NavyBlue app. It remembers every mark you lose, shows you the skills to fix first, and picks your next questions.
Get NavyBlue free on Google Play
