Grade 10 Maths · Functions
Sketch a trig graph
Draw a sine, cosine or tangent graph with the right shape, turning points, intercepts and asymptotes, for example y = 2 sin x for 0° ≤ x ≤ 360°.
- past paper questions use it
- 7 past paper questions use it
- videos
- 4 videos
Learn it: sketch a trig graph
Pick one and watch it, then try the questions below. Videos load only when you tap play.
Now try it on a real exam question
No sign-up. Takes 3 minutes.
Question 6.2 · November 2024 · Paper 2 · Provincial · 5 marks
Clearly indicate the intersections with the axes as well as the turning points on the graph.(5)
Work it out on paper first. Then mark yourself with the official memo, one tick at a time.
More past paper questions: sketch a trig graph
Work each one out first, then open the memo and check every tick.
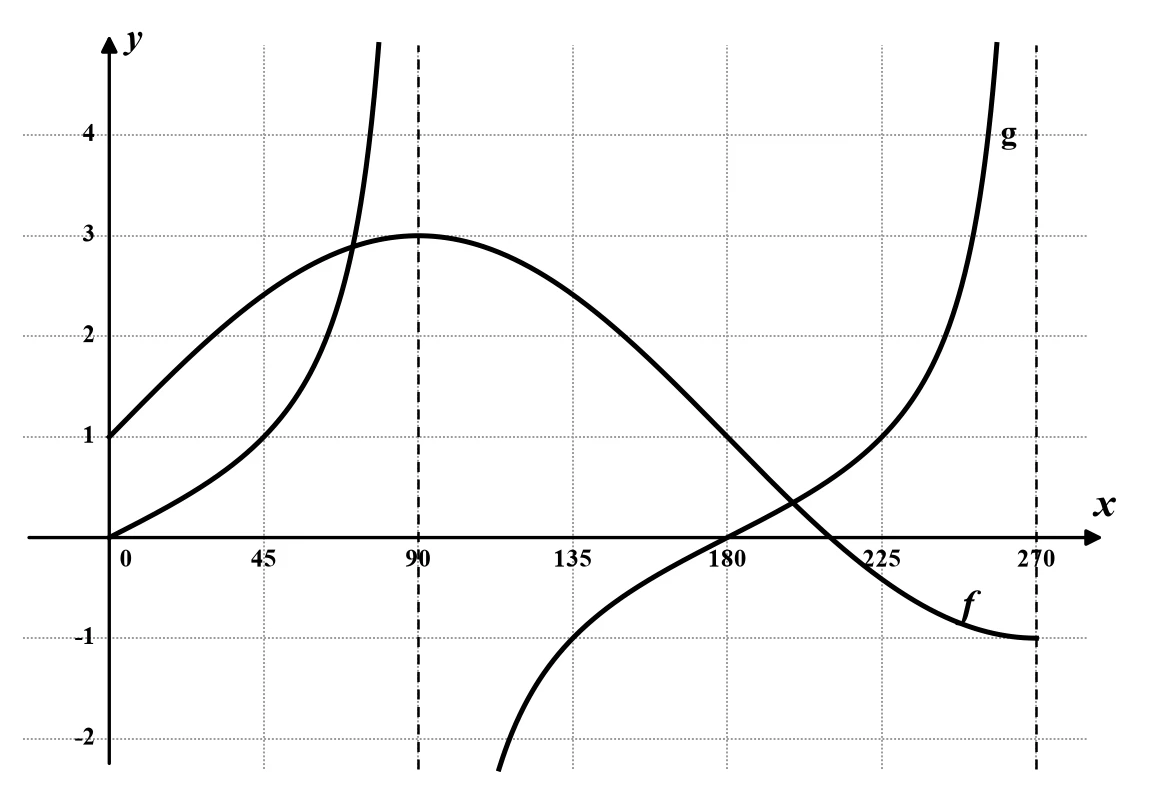
3. Question 6.1.2 · September 2024 · Provincial · 4 marks
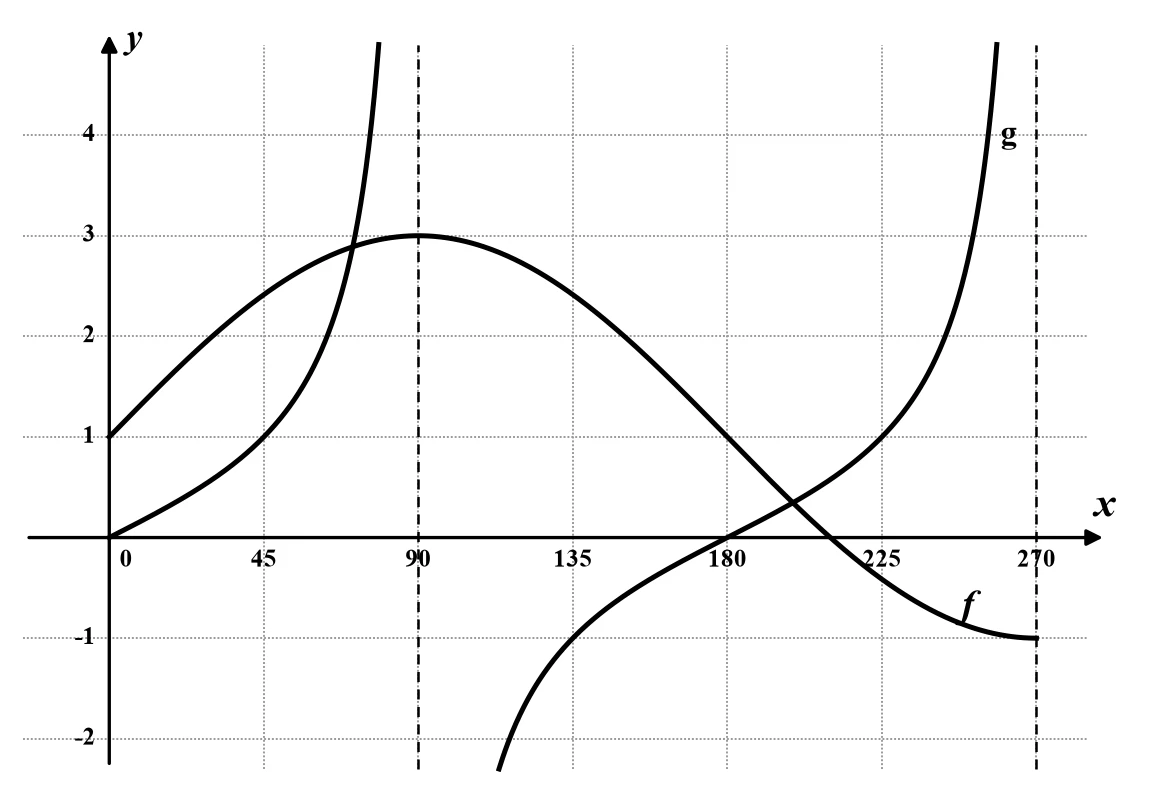
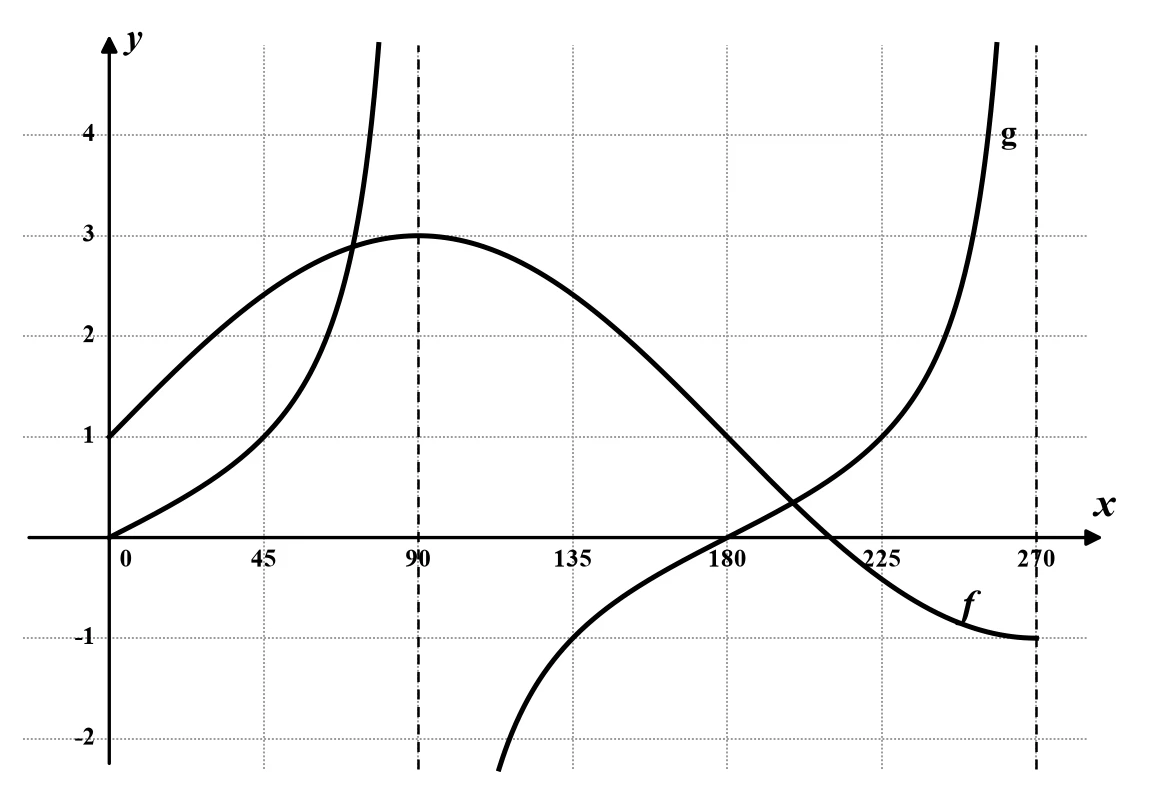
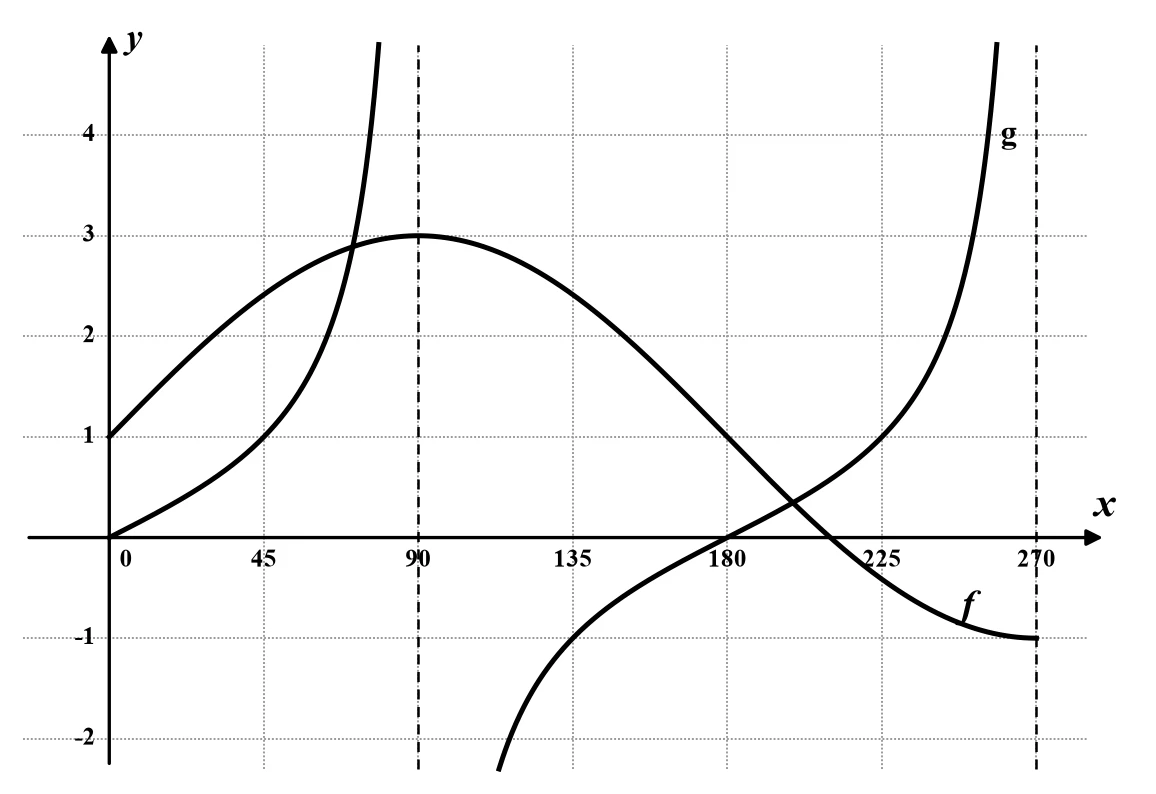
6.1 Given: and , where6.1.2 On the same set of axes provided on the DIAGRAM SHEET, sketch the graphs of f and g. Clearly indicate all intercepts with the axes, as well as turning points and end points of the graphs.(4)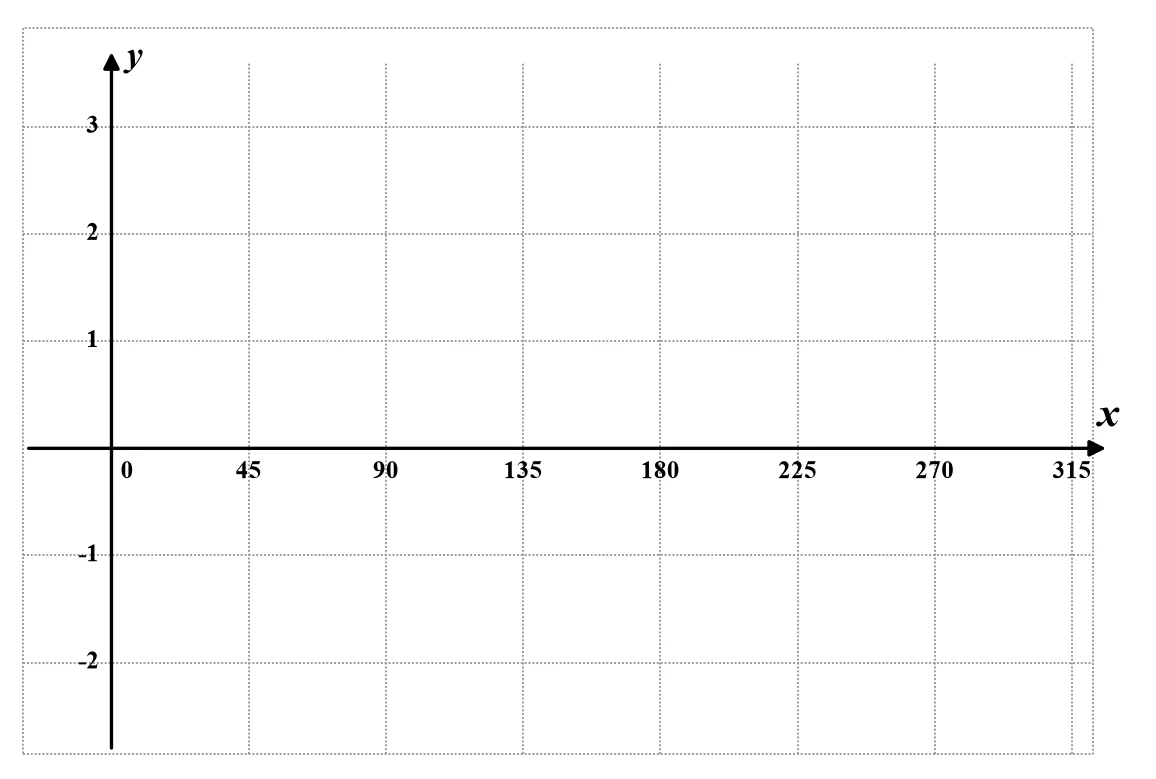
Show the memo (4 ticks)Memo
- ✓Shape of fSine curve for from to
1 mark · Sketch a trig graph
- ✓Shape of gTan curve for through and
1 mark · Sketch a trig graph
- ✓Asymptotes of g and
1 mark · Sketch a trig graph
- ✓Turning point of f
1 mark · Sketch a trig graph
- ✓
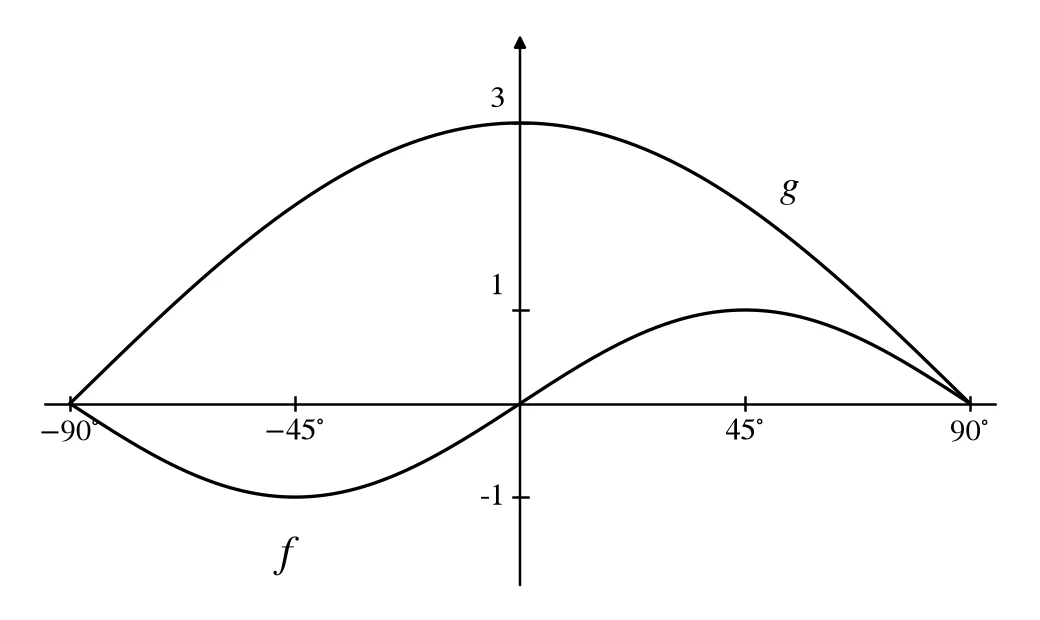
4. Question 4.1 · June 2024 · Paper 2 · Provincial · 6 marks
Given: and for4.1 Sketch the graphs of and on the same system of axes in the given interval.
Show all coordinates of the intercepts and the turning points.(6)Show the memo (6 ticks)Memo
- ✓Shape of fSine curve completing one full wave on
1 mark · Sketch a trig graph
- ✓Turning points of f and
1 mark · Sketch a trig graph
- ✓f passes through the origin
1 mark · Sketch a trig graph
- ✓Shape of gCosine curve with amplitude 3, above the x-axis on
1 mark · Sketch a trig graph
- ✓Turning point of g
1 mark · Sketch a trig graph
- ✓End points of f and gBoth graphs end at and
1 mark · Sketch a trig graph
- ✓
5. Question 3.2.1 · March 2022 · Provincial · 3 marks
3.2 The graph of for is drawn below.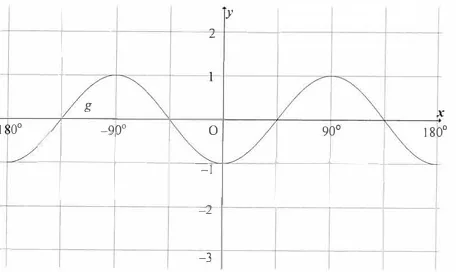 3.2.1 Draw the graph of for on the same set of axes with .(3)
Show the memo (1 tick)Memo
- ✓Sketch graph featuresTurning points: and
Intercepts: Passes through and approximately
y-intercept: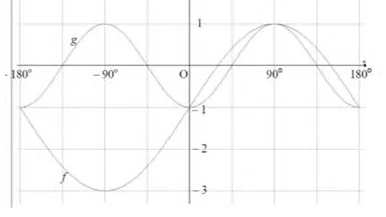
3 marks · Sketch a trig graph
- ✓
6. Question 8.1 · March 2022 · Provincial · 6 marks
8.1 Sketch the graphs of and for the domain .(6)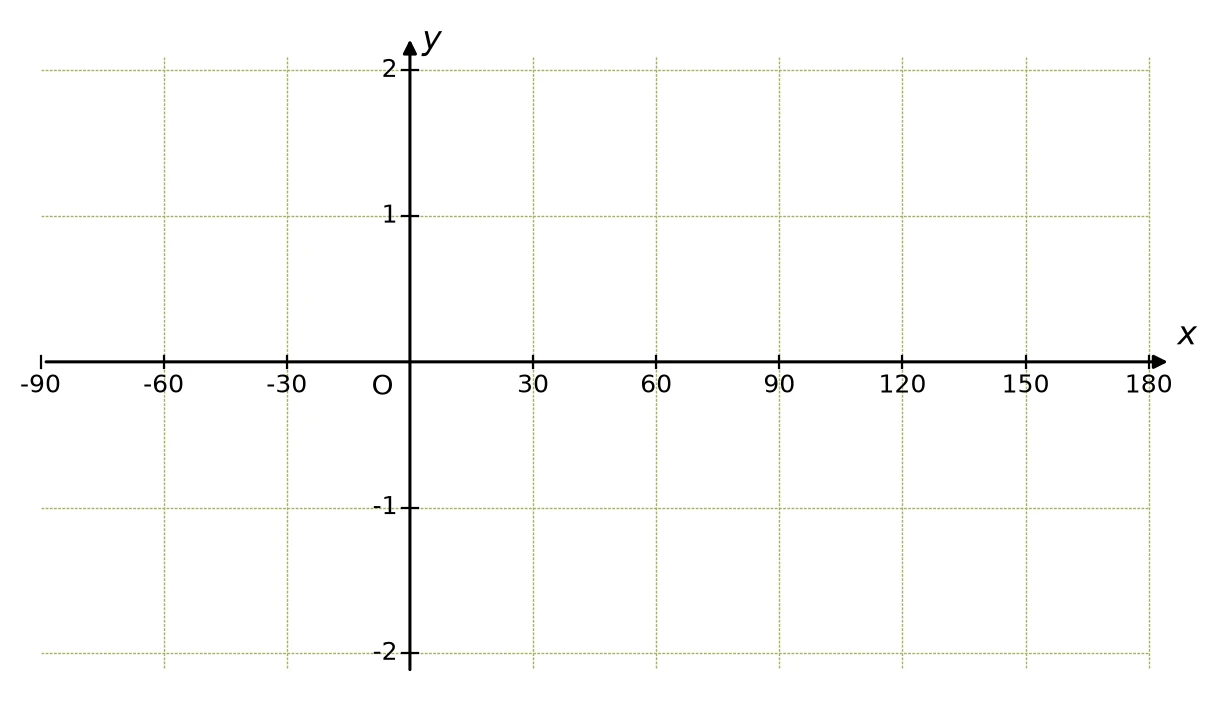
Show the memo (2 ticks)Memo
- ✓Graph f(x)x-intercepts:
Max:
Min: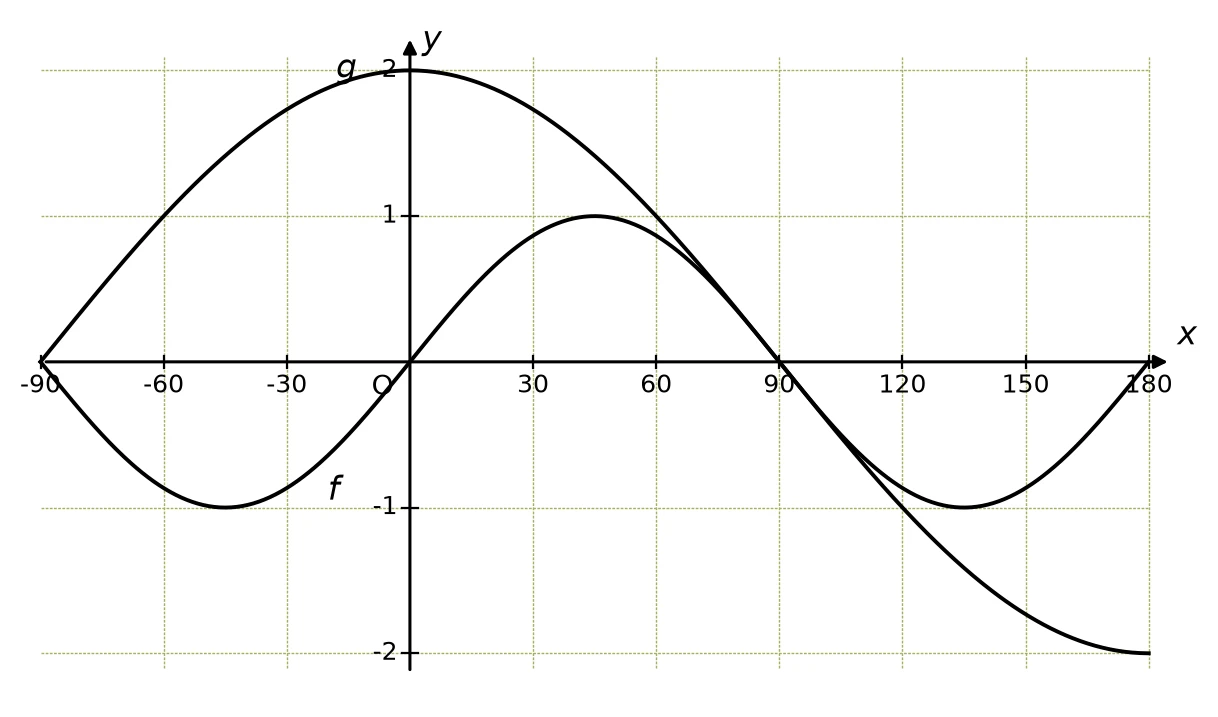
3 marks · Sketch a trig graph
- ✓Graph g(x)y-intercept:
x-intercepts:
Shape: Cosine curve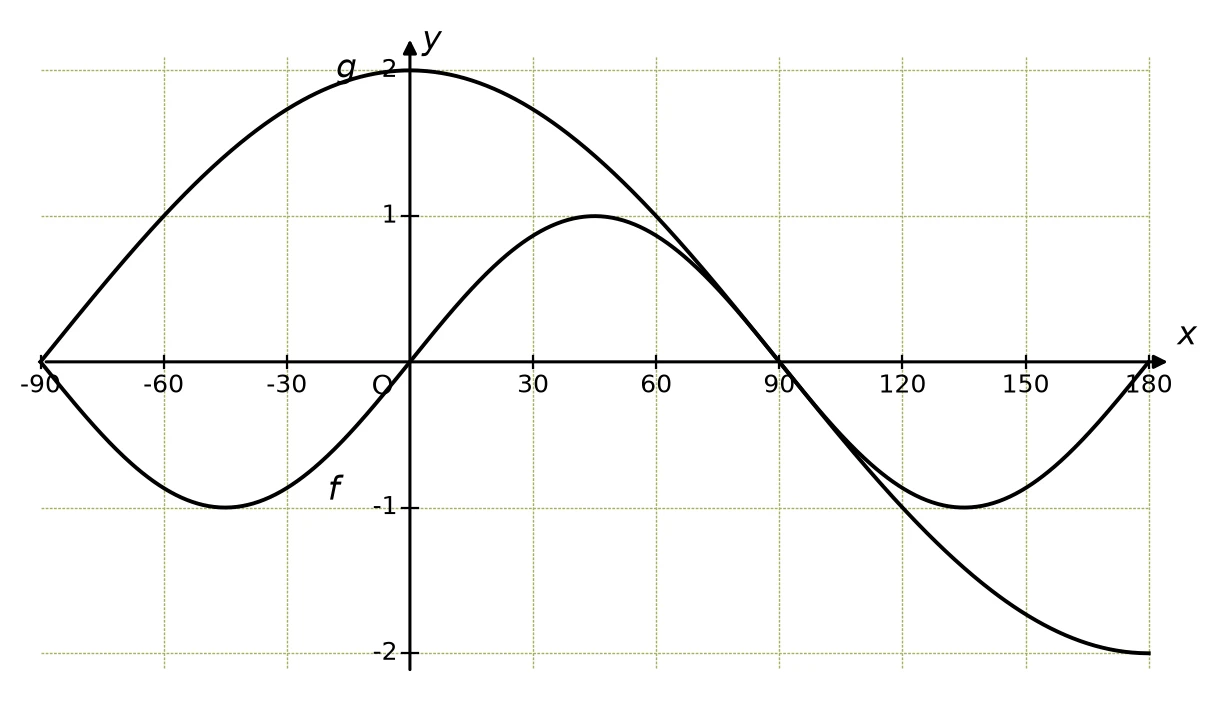
3 marks · Sketch a trig graph
- ✓
Free on Android
Know exactly which skill is costing you marks.
Mark past papers tick by tick in the NavyBlue app. It remembers every mark you lose, shows you the skills to fix first, and picks your next questions.
Get NavyBlue free on Google Play
