Grade 11 Maths · Probability
Draw a tree diagram
Draw a tree diagram for events that happen one after another, writing each outcome and its probability on every branch, for example tossing a coin twice.
- past paper questions use it
- 7 past paper questions use it
- videos
- 3 videos
Learn it: draw a tree diagram
Pick one and watch it, then try the questions below. Videos load only when you tap play.
Now try it on a real exam question
No sign-up. Takes 3 minutes.
Question a · Siyavula Grade 12 Mathematics, 10.3 Tools and techniques, Worked example 8 · 3 marks
Work it out on paper first. Then mark yourself with the official memo, one tick at a time.
More past paper questions: draw a tree diagram
Work each one out first, then open the memo and check every tick.
3. Question 9.3.1 · November 2025 · Paper 1 · Provincial · 3 marks
9.3 During the summer season in South Africa, the probability of sunny weather on any given day is 0,7. If it is sunny, the probability that a person uses sunscreen is . If it is not sunny, the probability of using sunscreen is .9.3.1 Draw a tree diagram, clearly labelling the branches and indicating the outcomes.(3)Show the memo (3 ticks)Memo
- ✓First branches i.e. S and S'First stage: Sunny (S) and Not sunny (S')
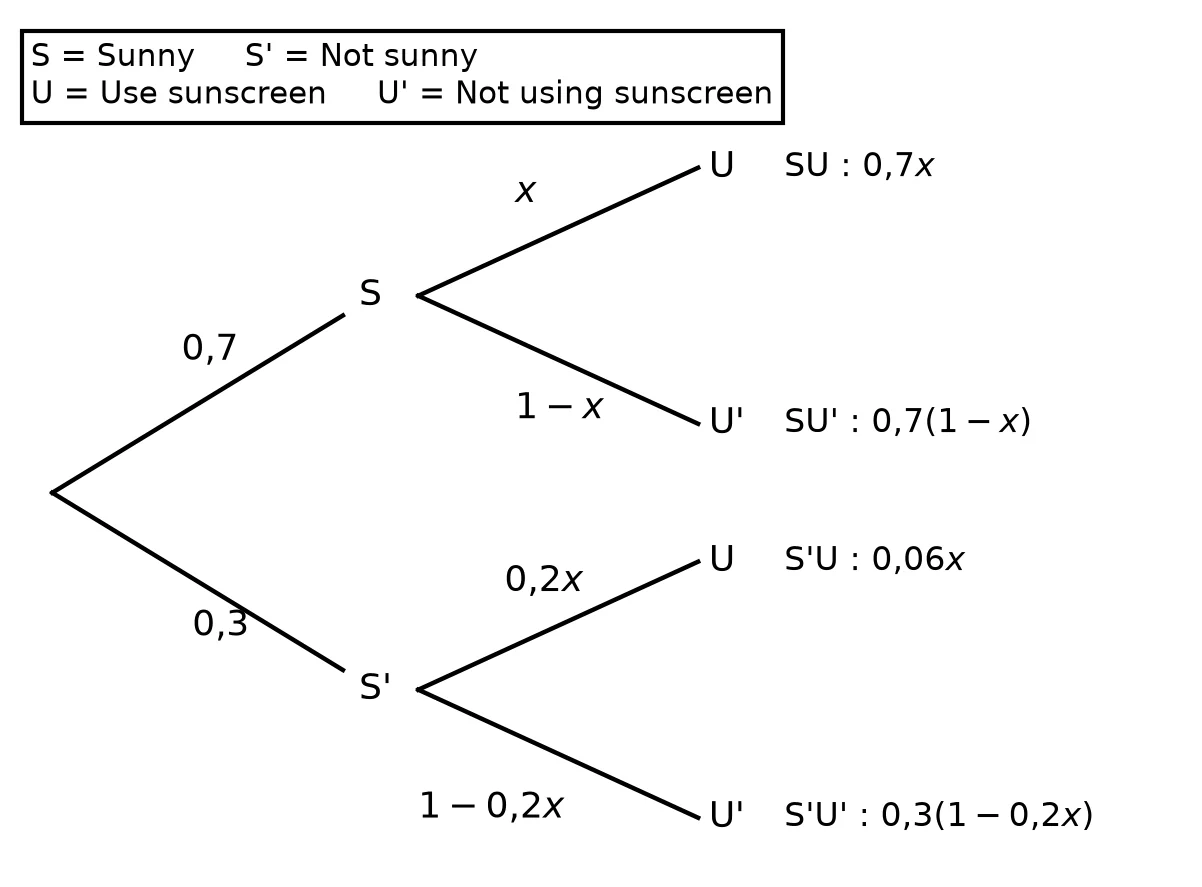
1 mark · Draw a tree diagram
- ✓Second branches i.e. U and U'After S: U and U'
After S': U and U'1 mark · Draw a tree diagram
- ✓OutcomesSU: ; SU': ; S'U: ; S'U':
1 mark · Draw a tree diagram
- ✓
4. Question 12.1.1 · September 2024 · Paper 1 · Provincial · 3 marks
12.1 The data obtained from a city's police department indicates that of all motor vehicles reported stolen, 80% were stolen by syndicates to be sold off, and 20% were stolen by individuals for personal use. Of the vehicles presumed stolen by syndicates: 24% were recovered within 48 hours, 16% were recovered after 48 hours, 60% were never recovered. Of those vehicles presumed stolen by individuals: 38% were recovered within 48 hours, 58% were recovered after 48 hours, 4% were never recovered.12.1.1 Draw a tree diagram for the given information above.(3)Show the memo (3 ticks)Memo
- ✓First levelSyndicate (0.8) / Individual (0.2)
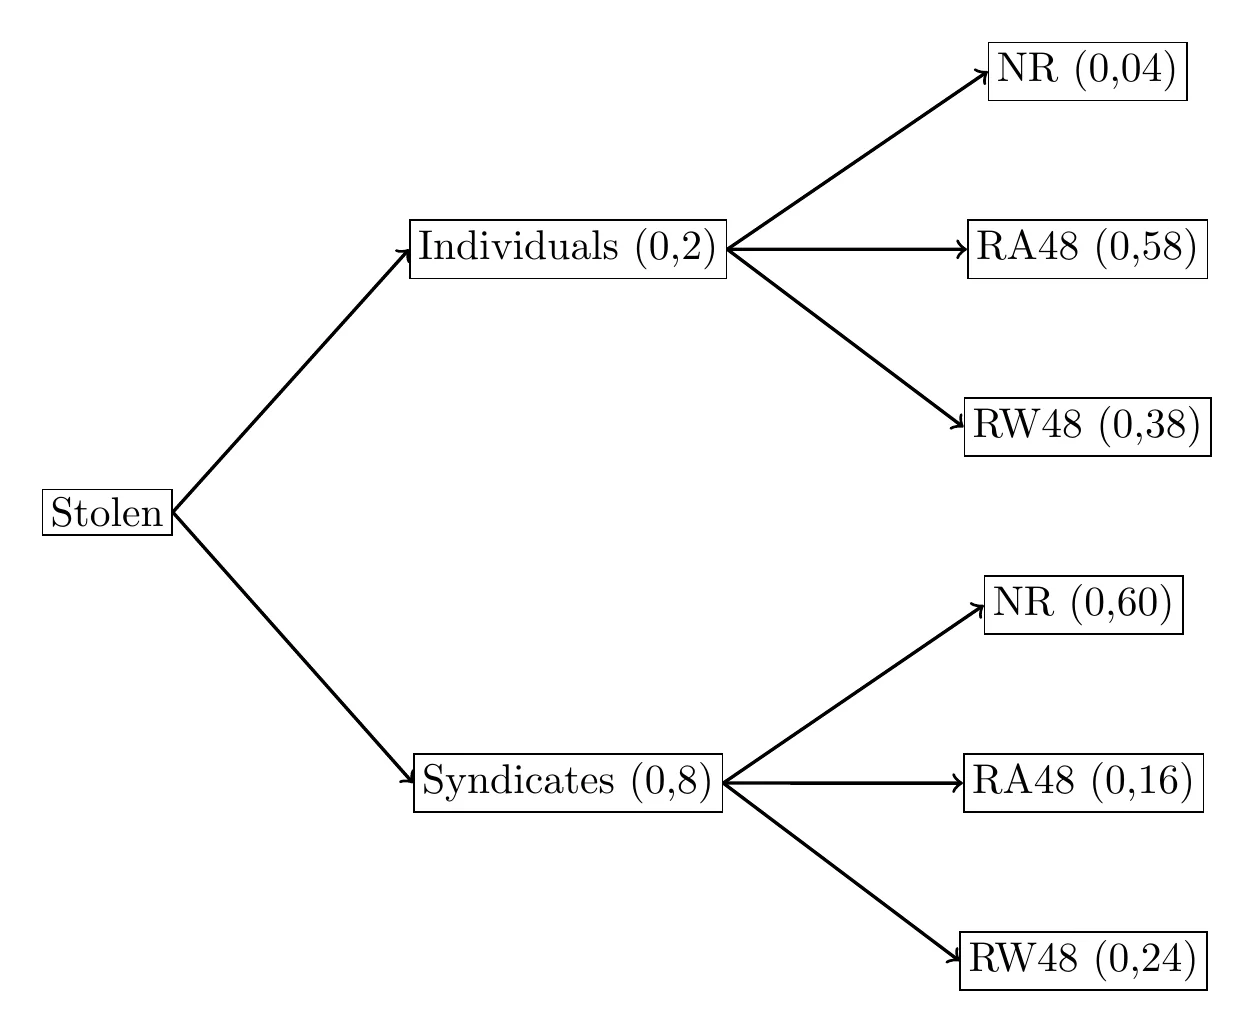
1 mark · Draw a tree diagram
- ✓Second level S0.24, 0.16, 0.60
1 mark · Draw a tree diagram
- ✓Second level I0.38, 0.58, 0.04
1 mark · Draw a tree diagram
- ✓
5. Question WE11 · Siyavula Grade 11 Mathematics, 10.4 Tree diagrams, Worked example 11 · 5 marks
WE11 You play the following game. You flip a coin. If it comes up tails, you get points and your turn ends. If it comes up heads, you get only point, but you can flip the coin again. If you flip the coin multiple times in one turn, you add up the points. You can flip the coin at most times in one turn. What is the probability that you will get exactly points in one turn? Draw a tree diagram to visualise the different possibilities.(5)Show the memo (5 ticks)Memo
- ✓First level of the treeFirst flip: ( pt) with probability ; ( pts) with probability
1 mark · Draw a tree diagram
- ✓Second and third levelsOnly after is the coin flipped again: then ( pts) or ( pts); after : ( pts) or ( pts). Every branch has probability .
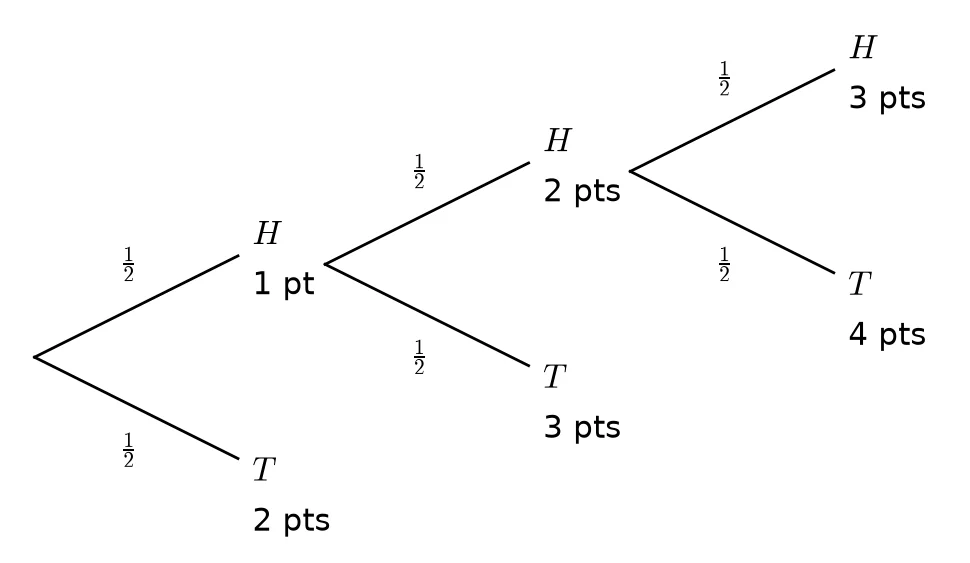
1 mark · Draw a tree diagram
- ✓Path (H; T):
1 mark · Calculate from a tree diagram
- ✓Path (H; H; H):
1 mark · Calculate from a tree diagram
- ✓Answer
1 mark · Calculate from a tree diagram
- ✓
6. Question WE12 · Siyavula Grade 11 Mathematics, 10.4 Tree diagrams, Worked example 12 · 5 marks
WE12 A person takes part in a medical trial that tests the effect of a medicine on a disease. Half the people are given medicine and the other half are given a sugar pill, which has no effect on the disease. The medicine has a chance of curing someone. But, people who do not get the medicine still have a chance of getting well. There are people in the trial and they all have the disease. Talwar takes part in the trial, but we do not know whether he got the medicine or the sugar pill. Draw a tree diagram of all the possible cases. What is the probability that Talwar gets cured?(5)Show the memo (5 ticks)Memo
- ✓First level of the treeMedicine ; sugar pill
1 mark · Draw a tree diagram
- ✓Second level of the treeMedicine: cured ; not cured
Sugar pill: cured ; not cured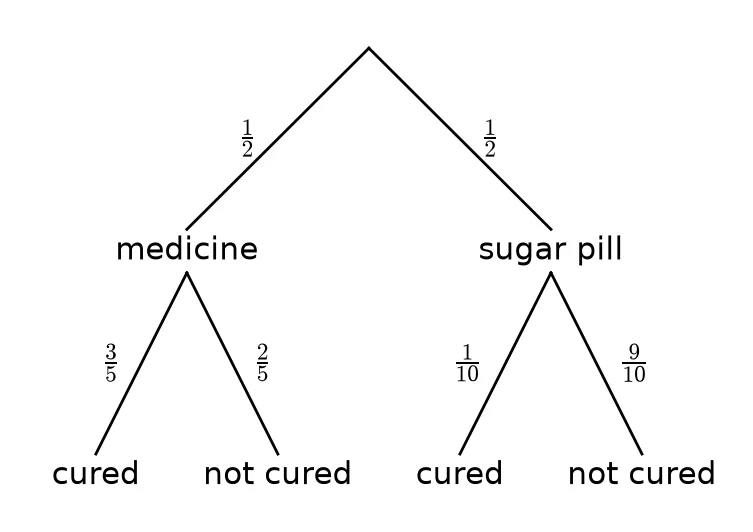
1 mark · Draw a tree diagram
- ✓Path: medicine, cured
1 mark · Calculate from a tree diagram
- ✓Path: sugar pill, cured
1 mark · Calculate from a tree diagram
- ✓Answer
The probability that Talwar is cured is .1 mark · Calculate from a tree diagram
- ✓
Free on Android
Know exactly which skill is costing you marks.
Mark past papers tick by tick in the NavyBlue app. It remembers every mark you lose, shows you the skills to fix first, and picks your next questions.
Get NavyBlue free on Google Play
