Grade 11 Maths · Functions · Paper 1
Interpretation of Trigonometric Functions Grade 11
Real Interpretation of Trigonometric Functions past paper questions and answers from 2023 to 2025, with each memo split into the ticks examiners give. Try one, mark yourself, and see exactly which skill cost you marks.
- past paper questions
- 22 past paper questions
- skills
- 6 skills
- videos
- 6 videos
Try a Interpretation of Trigonometric Functions exam question
No sign-up. Takes 3 minutes.
Question 5.5 · November 2025 · Paper 1 · Provincial · 2 marks
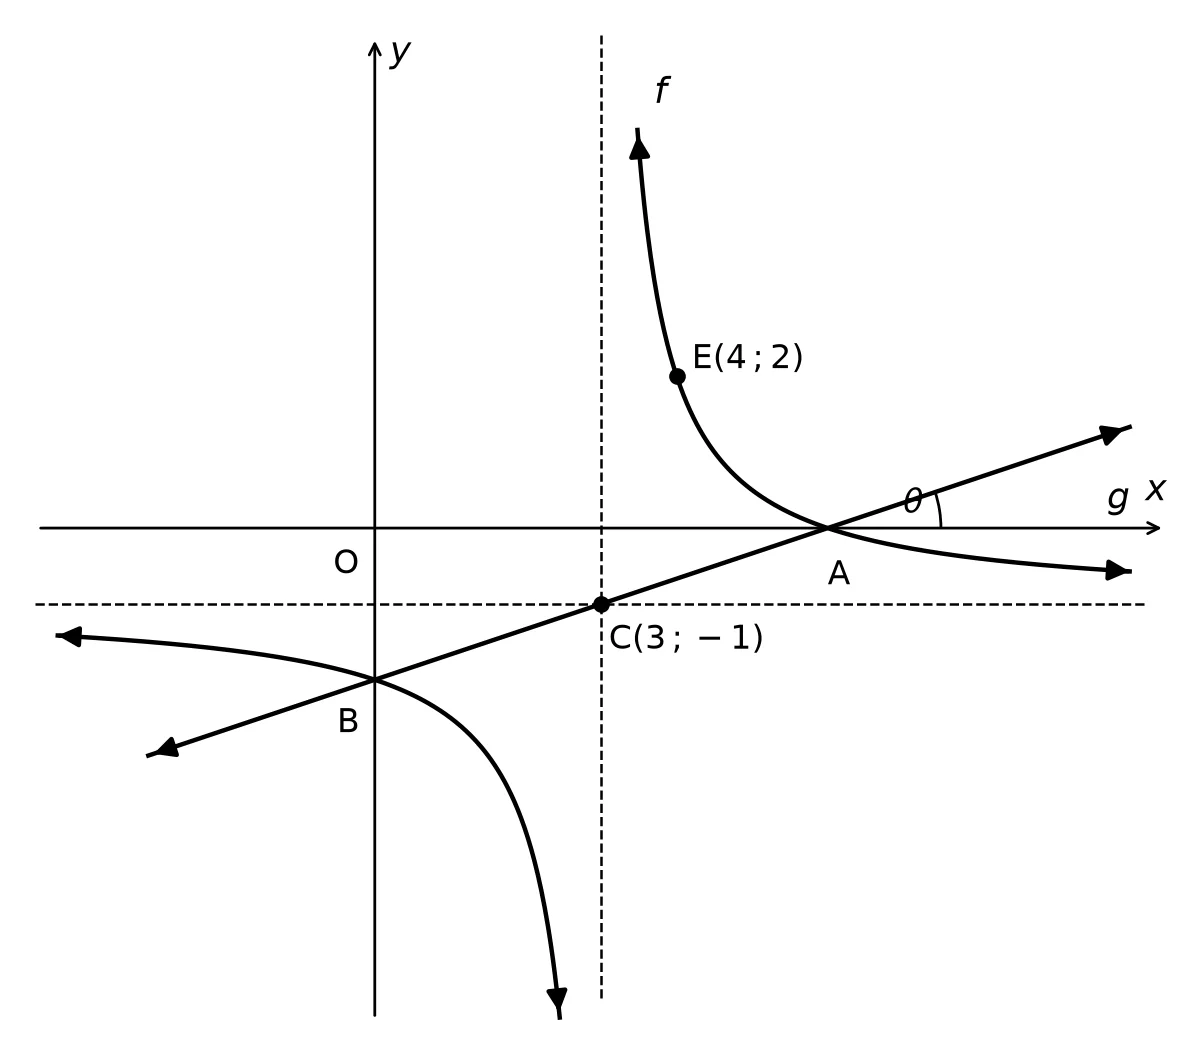
Work it out on paper first. Then mark yourself with the official memo, one tick at a time.
Interpretation of Trigonometric Functions skills
Each skill is one thing a memo gives a tick for. Tap one for its own questions, notes and videos.
- Shift a graphSlide a graph left, right, up or down and write its new equation (for example moving y = x² two units right gives y = (x − 2)²).14 past paper questions · 3 videos
- Solve an inequality from a graphUse a graph to find the x-values where it is above or below the x-axis or another graph (for example where f(x) > 0).26 past paper questions · 3 videos
- State increasing and decreasing intervalsGive the x-values where a graph is going up or going down (for example y = x² is decreasing for x < 0 and increasing for x > 0).5 past paper questions · 3 videos
- Solve product inequality from graphsUse two graphs to find where f(x) × g(x) or f(x) ÷ g(x) is positive or negative by comparing their signs on each interval.12 past paper questions · 3 videos
- Find trig graph amplitude and rangeFind the highest and lowest values, amplitude and range of a sine or cosine graph, for example y = 3 cos x + 1 has range −2 to 4.16 past paper questions · 4 videos
- Find equation of a trig graphRead the numbers in a trig graph's equation from its picture, for example a graph with amplitude 2 and period 180° is y = 2 sin 2x.5 past paper questions · 4 videos
More Interpretation of Trigonometric Functions Grade 11 questions and answers
Try each one on paper before you open the memo.
4. Question 6.4.2 · November 2025 · Paper 1 · Provincial · 3 marks
The graphs of and are drawn below. is the reflection of along the -axis. A and B are symmetrical on along , i.e. the axes of symmetry.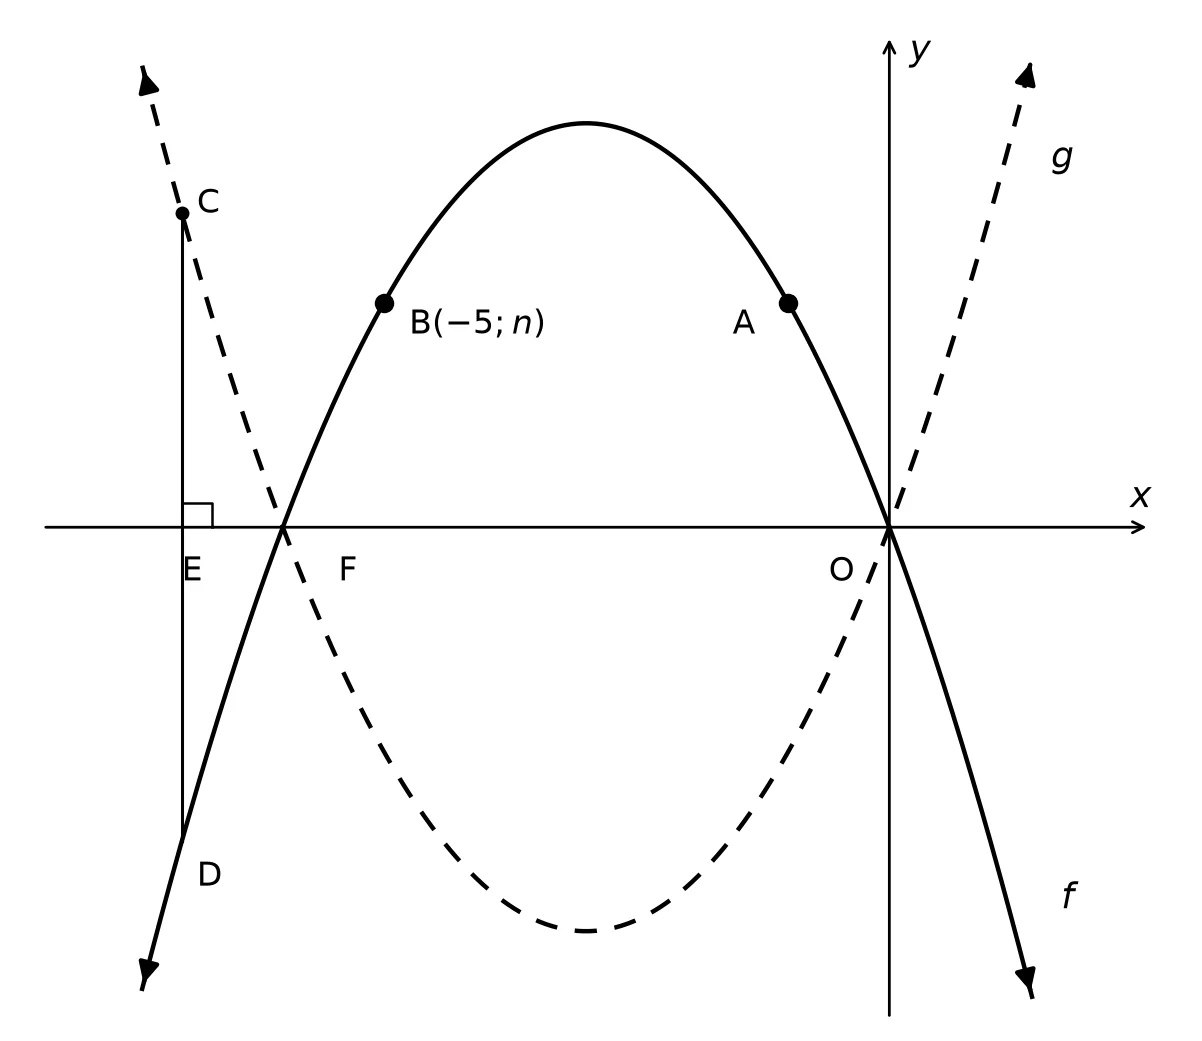 6.4 Determine the value(s) of for which:6.4.2 will have two real roots that have different signs.(3)
Show the memo (2 ticks)Memo
- ✓-values
or1 mark · Find the x-intercepts
- ✓Answer
2 marks · Shift a graph
- ✓
5. Question 6.2 · November 2024 · Paper 2 · Provincial · 2 marks
The graph of in the interval of has been drawn in the diagram below.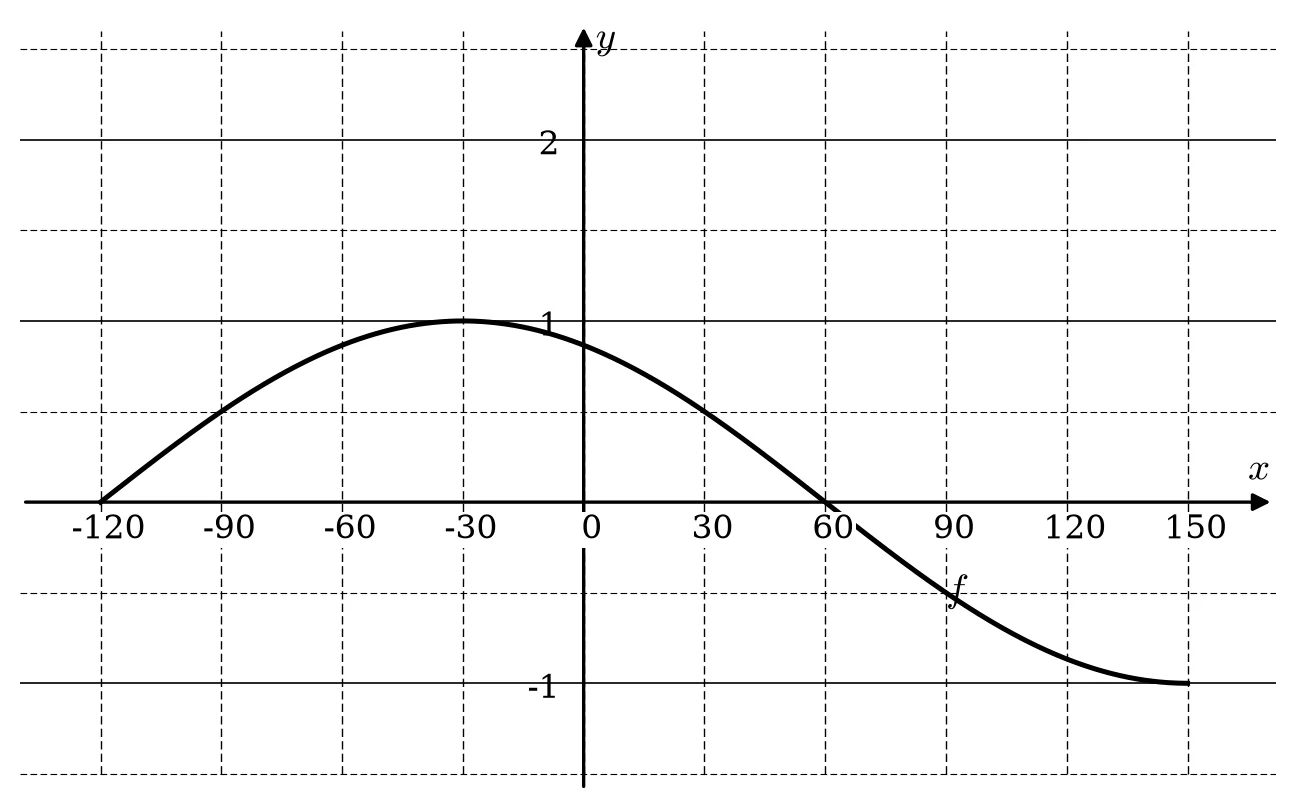 6.2 Write down the range of .(2)
Show the memo (2 ticks)Memo
- ✓Correct interval to
1 mark · Find trig graph amplitude and range
- ✓Correct notation or
1 mark · Find trig graph amplitude and range
- ✓
6. Question 5.6 · November 2024 · Paper 1 · Provincial · 3 marks
The lines and are the axes of symmetry of the function .5.6 For which values of will ?(3)Show the memo (2 ticks)Memo
- ✓
1 mark · Solve product inequality from graphs
- ✓
2 marks · Solve product inequality from graphs
- ✓
7. Question 6.4 · November 2024 · Paper 1 · Provincial · 3 marks
Sketched below is the graph of for .
A and B are the -intercepts and C the -intercept of .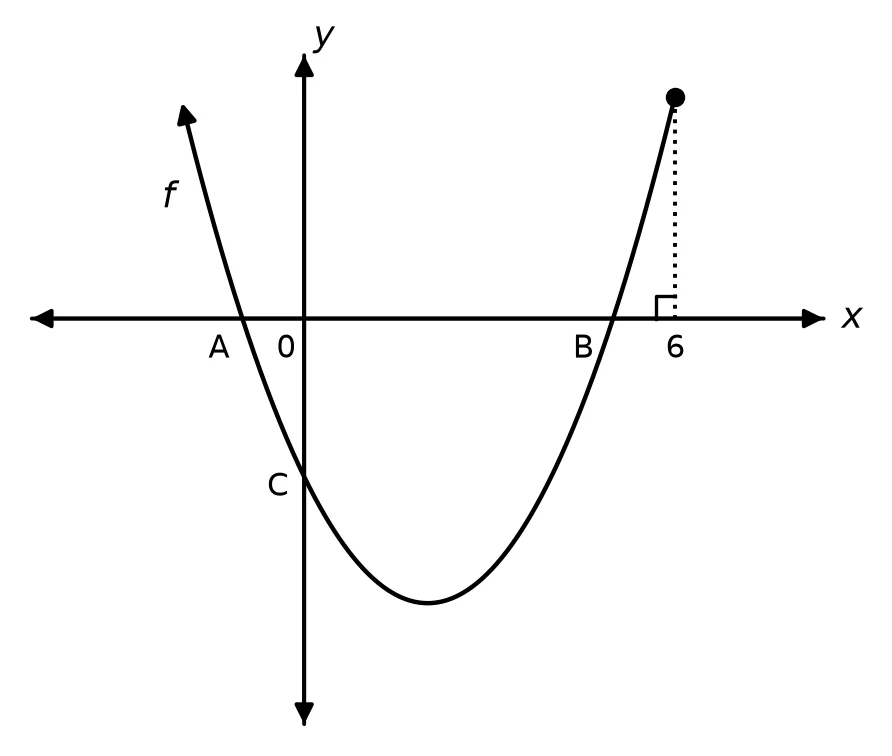 6.4 Write down the equation of in the form , if it is given that is obtained by shifting two units to the right and five units up.(3)
Show the memo (3 ticks)Memo
- ✓
1 mark · Shift a graph
- ✓
1 mark · Shift a graph
- ✓Answer
1 mark · Collect like terms
- ✓
8. Question 6.3 · November 2024 · Paper 2 · Provincial · 2 marks
6.3 For which values of would ; ?(2)Show the memo (2 ticks)Memo
- ✓Interval
1 mark · Solve an inequality from a graph
- ✓NotationOR
1 mark · Solve an inequality from a graph
- ✓
9. Question 5.6 · November 2023 · Paper 1 · Provincial · 2 marks
The diagram below shows the graph of . The asymptotes of intersect at and cuts the -axis at .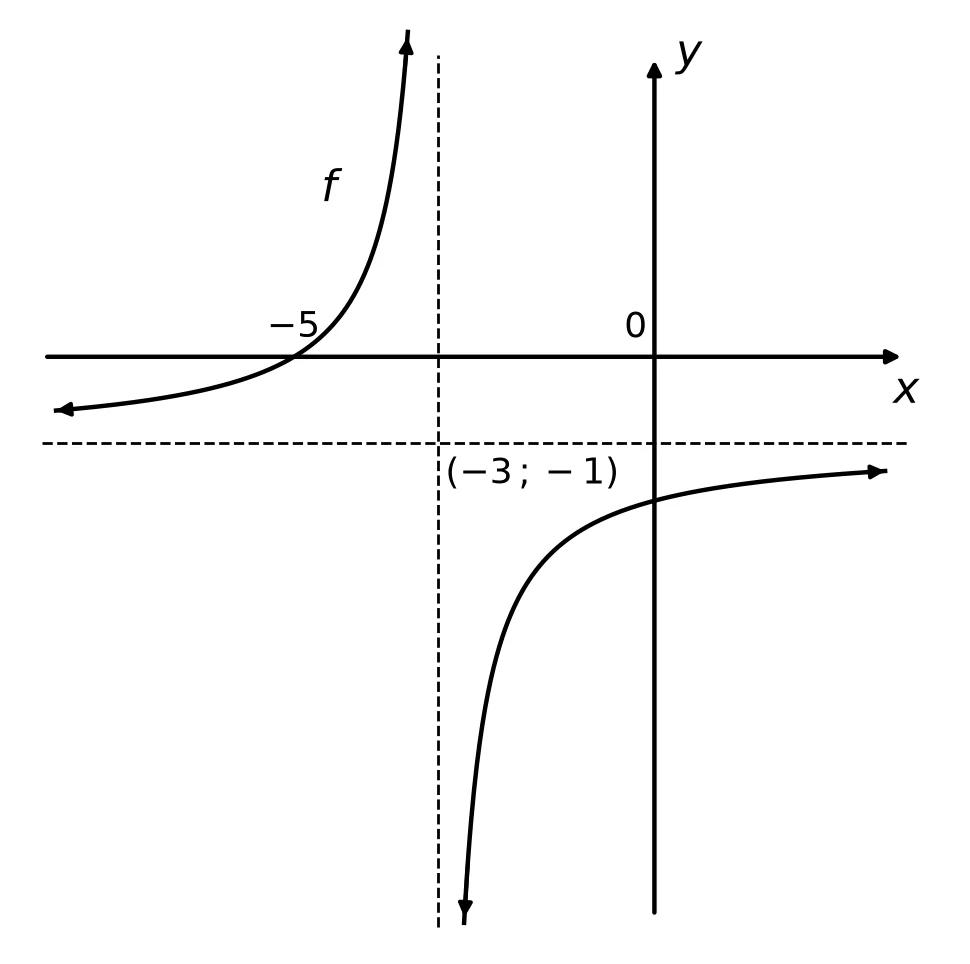 5.6 For which values of is ?(2)
Show the memo (1 tick)Memo
- ✓Answer
2 marks · Solve an inequality from a graph
- ✓
10. Question 7.7 · November 2023 · Paper 1 · Provincial · 2 marks
The diagram below shows the graphs of and . D and F are points of intersection of and . T and U are the -intercepts of , E the -intercept of and S is the -intercept of . VW is a straight line drawn parallel to the -axis.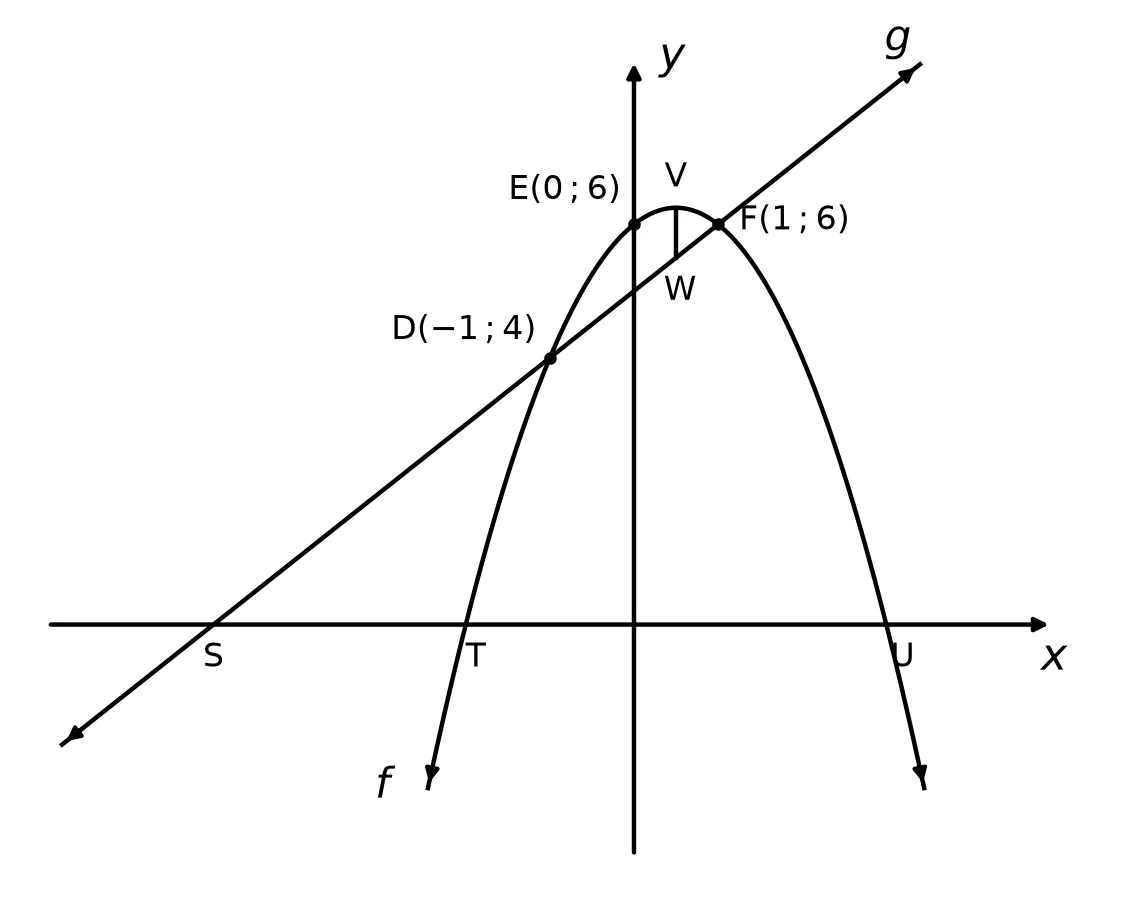 7.7 Determine the values of for which .(2)
Show the memo (2 ticks)Memo
- ✓
1 mark · Solve an inequality from a graph
- ✓or
1 mark · Solve an inequality from a graph
- ✓
Interpretation of Trigonometric Functions Grade 11 videos
Short lessons from South African teachers first. Videos load only when you tap play, to save your data.
Free on Android
Know exactly which skill is costing you marks.
Mark past papers tick by tick in the NavyBlue app. It remembers every mark you lose, shows you the skills to fix first, and picks your next questions.
Get NavyBlue free on Google Play
