Grade 10 Maths · Probability
Find probability from a Venn diagram
Find a probability by choosing and adding the right parts of a Venn diagram, for example learners who play soccer only, or neither sport.
- past paper questions use it
- 10 past paper questions use it
- videos
- 3 videos
Learn it: find probability from a venn diagram
Pick one and watch it, then try the questions below. Videos load only when you tap play.
Now try it on a real exam question
No sign-up. Takes 3 minutes.
Question 11.2 · November 2024 · Paper 1 · National (DBE) · 2 marks
Work it out on paper first. Then mark yourself with the official memo, one tick at a time.
More past paper questions: find probability from a venn diagram
Work each one out first, then open the memo and check every tick.
3. Question 9.1.3 · November 2025 · Paper 1 · Provincial · 2 marks
9.1 A and B are independent events. It is further given that:
• P(A) = 0,3
• P(B) = 0,69.1.3 Calculate P(not A and not B).(2)Show the memo (1 tick)Memo
- ✓AnswerP(not A and not B) P[not(A or B)]
2 marks · Find probability from a Venn diagram
- ✓
4. Question 3.1.3 · September 2024 · Provincial · 3 marks
3.1 Given: ; and . Determine the:3.1.3 (3)Show the memo (2 ticks)Memo
- ✓(double tick)
2 marks · Find probability from a Venn diagram
- ✓Answer
1 mark · Find probability from a Venn diagram
- ✓
5. Question 9.2.2 · November 2024 · Paper 1 · Provincial · 2 marks
9.2 At a certain high school, a survey was carried out on 110 learners, about their subject choices. The Venn diagram shows the results of the survey in terms of:
• Mathematics (M)
• Physical Sciences (P)
• Accounting (A)
Answer the questions that follow.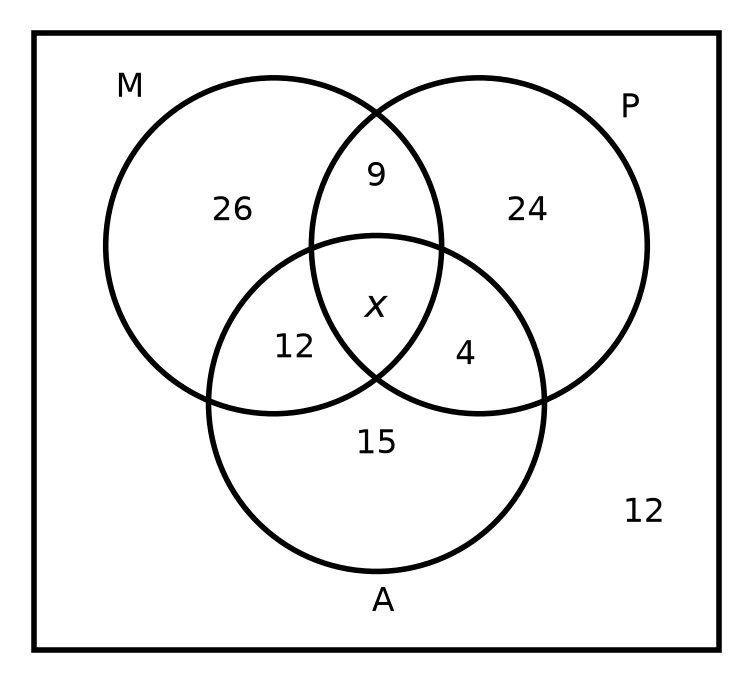 9.2.2 Calculate the probability that a learner chosen at random does only one of the three subjects.(2)
Show the memo (2 ticks)Memo
- ✓
1 mark · Find probability from a Venn diagram
- ✓Probability or or
1 mark · Find probability from a Venn diagram
- ✓
Free on Android
Know exactly which skill is costing you marks.
Mark past papers tick by tick in the NavyBlue app. It remembers every mark you lose, shows you the skills to fix first, and picks your next questions.
Get NavyBlue free on Google Play
