Grade 10 Maths · Functions · Paper 1
Graphs Grade 10
Real Graphs past paper questions and answers from 2024 to 2025, with each memo split into the ticks examiners give. Try one, mark yourself, and see exactly which skill cost you marks.
- past paper questions
- 17 past paper questions
- skills
- 4 skills
- videos
- 4 videos
Try a Graphs exam question
No sign-up. Takes 3 minutes.
Question 5.3 · June 2025 · Paper 1 · Provincial · 3 marks
DBQ is a line perpendicular to the x-axis with D and B on and respectively. The coordinates of Q are .
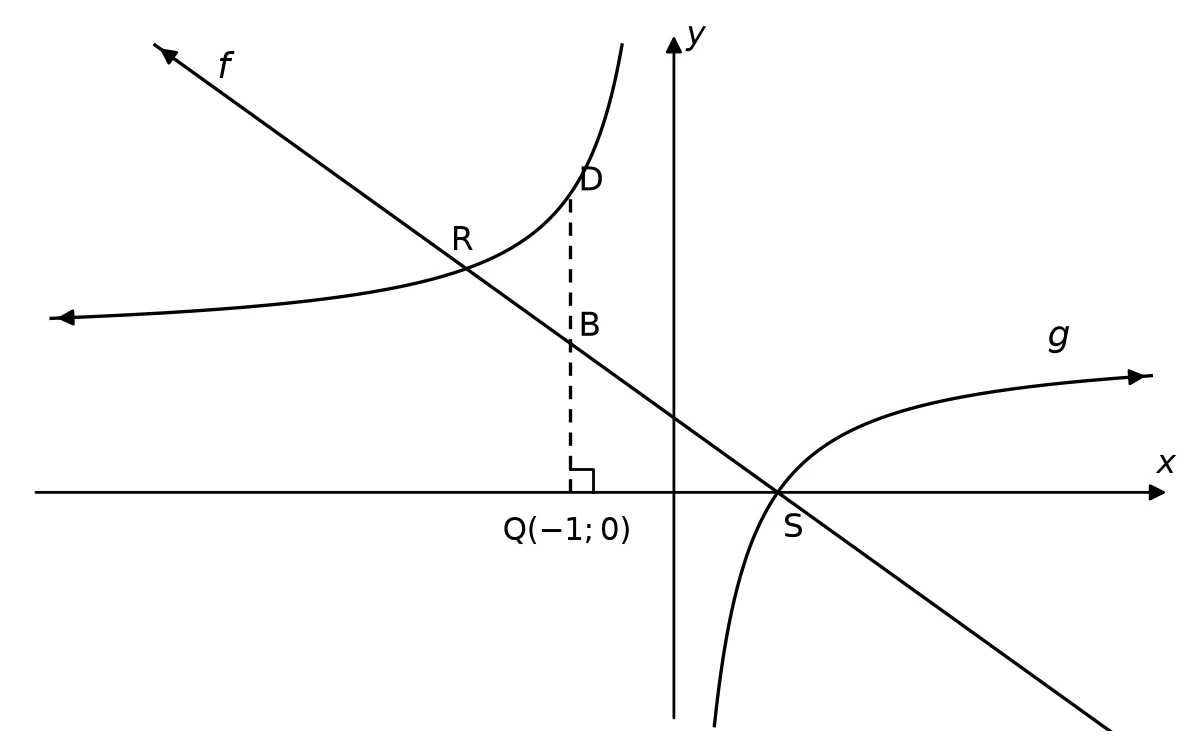
Work it out on paper first. Then mark yourself with the official memo, one tick at a time.
Graphs skills
Each skill is one thing a memo gives a tick for. Tap one for its own questions, notes and videos.
- Plot and read pointsRead the coordinates of a point on a graph, or plot a given point in the right place (for example the point (3; −2) is 3 right and 2 down).12 past paper questions · 2 videos
- Substitute into a formulaReplace the letters in a formula or expression with the given numbers and work out the value (for example if x = 3, then 2x + 1 = 7).43 past paper questions · 3 videos
- Interpret or draw a global graphDescribe what a graph of a real situation shows, like where it goes up, goes down or stays flat, and where it is highest or lowest.3 past paper questions · 3 videos
- Sketch a graph from its equationDraw a parabola, hyperbola, exponential or cubic graph from its equation with the right shape, direction and position, showing key points.12 past paper questions · 4 videos
More Graphs Grade 10 questions and answers
Try each one on paper before you open the memo.
4. Question 4.1.1 · June 2025 · Paper 1 · Provincial · 3 marks
4.1 Given:4.1.1 Sketch the graph of . Clearly indicate all the intercepts with the axes on the graph.(3)Show the memo (1 tick)Memo
- ✓Describe the correct sketch of the graphThe graph must be a parabola showing:
1. A concave down shape (opening downwards)
2. A y-intercept and turning point at
3. Two x-intercepts at and3 marks · Sketch a graph from its equation
- ✓
5. Question WE23.3 · Siyavula Grade 8 Mathematics, 23 Graphs, The Cartesian plane, Worked example 23.3 · 2 marks
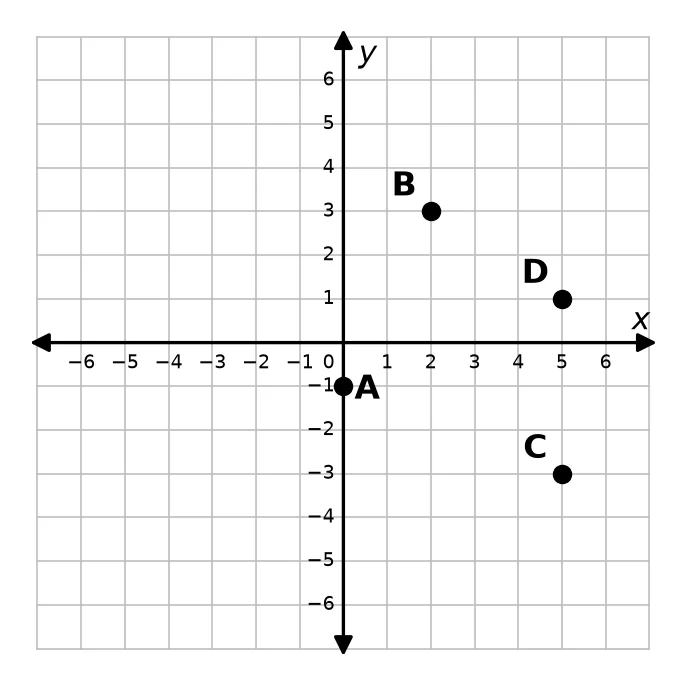 WE23.3 The graph below shows the Cartesian plane and four points. The points are labelled , , and . Which point has the coordinates ?(2)
Show the memo (2 ticks)Memo
- ✓Use the coordinatesIn , and .
From the origin, move units to the right (the -coordinate is positive), then unit upwards (the -coordinate is positive).1 mark · Plot and read points
- ✓AnswerThe point that has the coordinates is point .
1 mark · Plot and read points
- ✓
6. Question WE23.4 · Siyavula Grade 8 Mathematics, 23 Graphs, The Cartesian plane, Worked example 23.4 · 2 marks
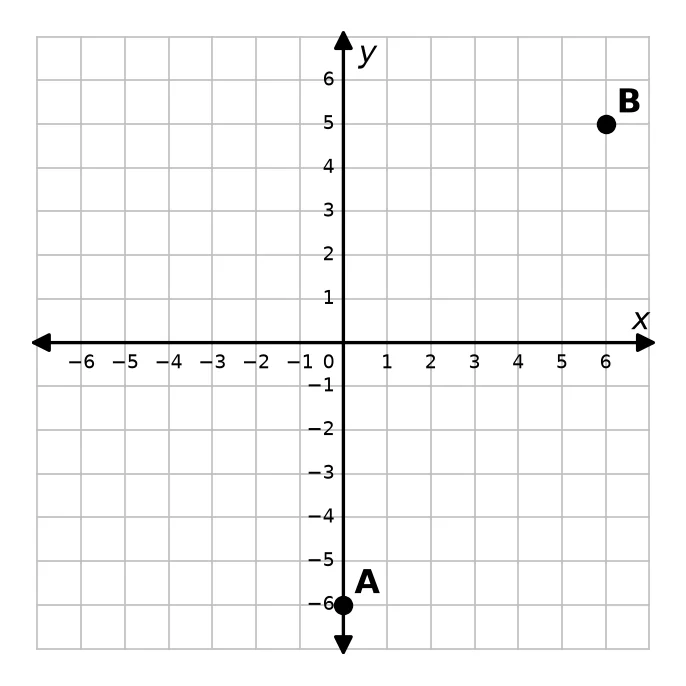 WE23.4 The diagram shows the Cartesian plane and two points. The points are labelled and . Write down the coordinates of and .(2)
Show the memo (2 ticks)Memo
- ✓Coordinates of B is units to the right of the origin and units above it.
1 mark · Plot and read points
- ✓Coordinates of A lies on the -axis, so its -coordinate is . It is units below the origin.
1 mark · Plot and read points
- ✓
7. Question d · Siyavula Grade 8 Mathematics, 23 Graphs, Analysing and interpreting global graphs, Worked example 23.1 · 3 marks
Aliwal Shoal in KwaZulu-Natal is one of the best scuba-diving spots in South Africa. The graph shows the depths that a scuba diver reached during a minute dive.
Use the graph to answer the questions.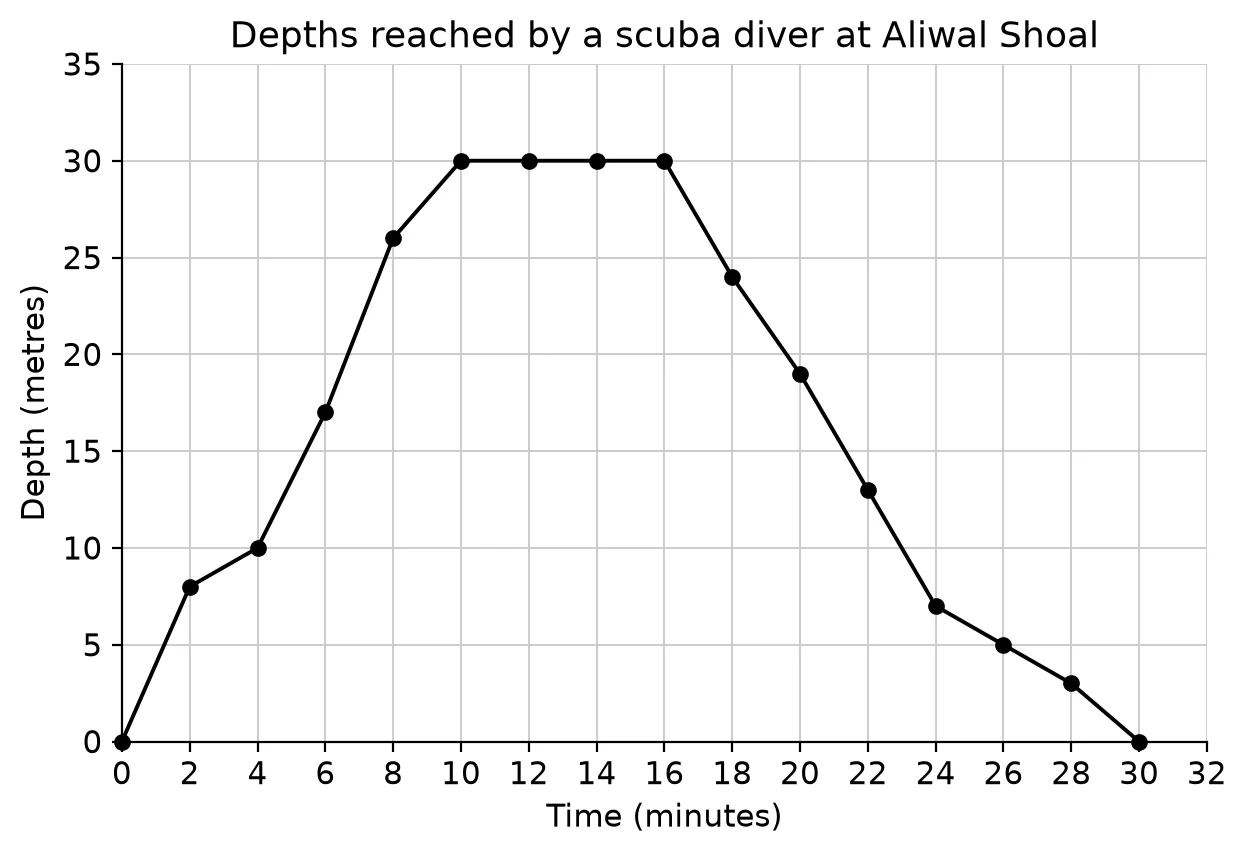 d Complete each sentence by filling in the missing words:
(i) Between and minutes the depth of the scuba diver is ______ .
(ii) Between and minutes the depth of the scuba diver remains ______ .
(iii) Between and minutes the depth of the scuba diver is ______ .(3)Show the memo (3 ticks)Memo
- ✓0 to 10 minutesBetween and minutes the depth of the scuba diver is increasing.
1 mark · Interpret or draw a global graph
- ✓10 to 16 minutesBetween and minutes the depth of the scuba diver remains constant.
1 mark · Interpret or draw a global graph
- ✓16 to 30 minutesBetween and minutes the depth of the scuba diver is decreasing.
1 mark · Interpret or draw a global graph
- ✓
8. Question b · Siyavula Grade 8 Mathematics, 23 Graphs, Drawing global graphs, Worked example 23.2 · 2 marks
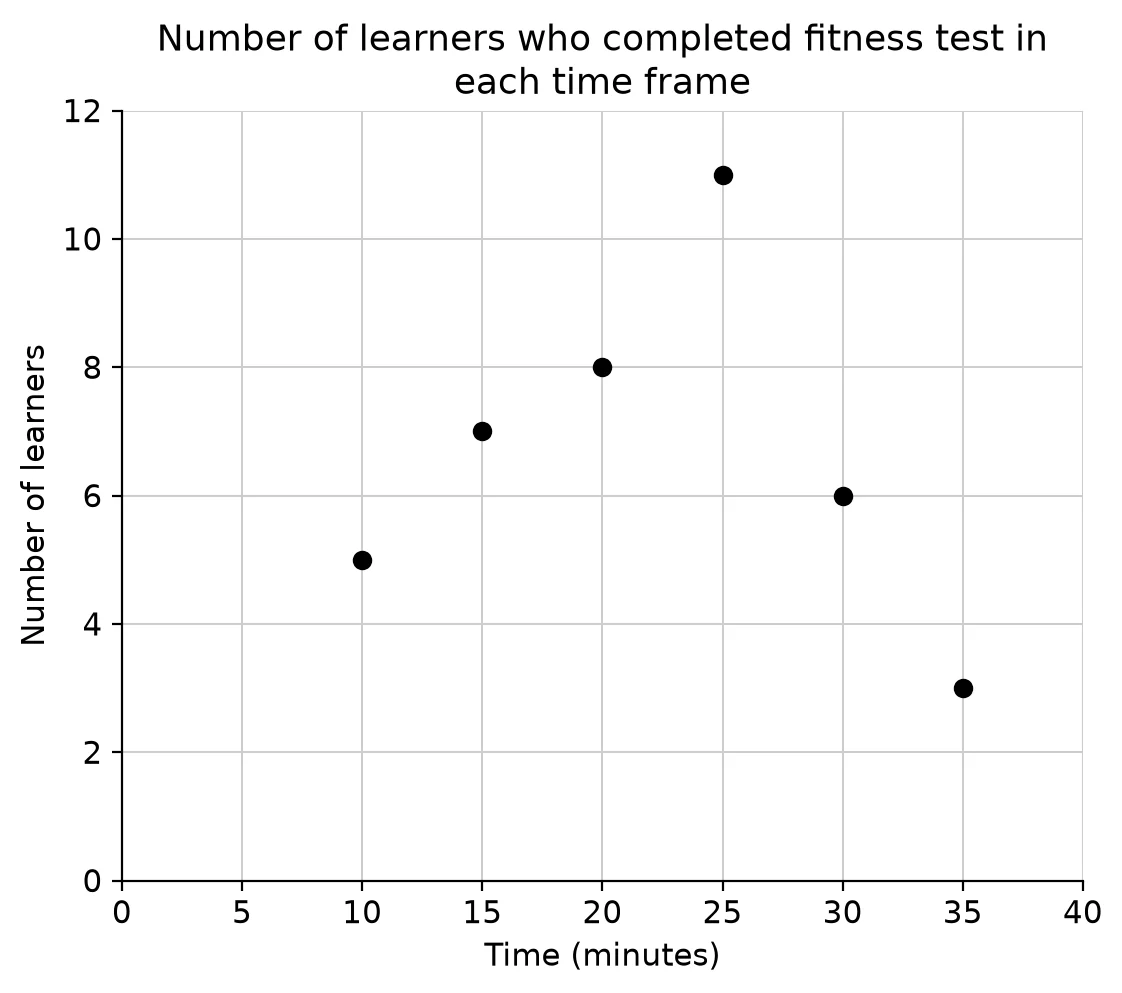
Forty learners completed a physical fitness test consisting of different exercises. learners completed the test in minutes, learners completed the test in minutes, learners completed the test in minutes, learners completed the test in minutes, learners completed the test in minutes and learners completed the test in minutes.
Use the information provided to answer the questions.b Use the information provided to draw a suitable graph.(2)Show the memo (2 ticks)Memo
- ✓Plot the pointsPlot the points , , , , and with time (minutes) on the horizontal axis and number of learners on the vertical axis.
1 mark · Plot and read points
- ✓Points not joinedThe data is discrete, so the points are not joined by a line (see the graph).
1 mark · Interpret or draw a global graph
- ✓
9. Question 5.4 · November 2025 · Paper 2 · Provincial · 1 mark
Given: and ,
The graphs of and are drawn below.
Use the graphs to answer the following questions where :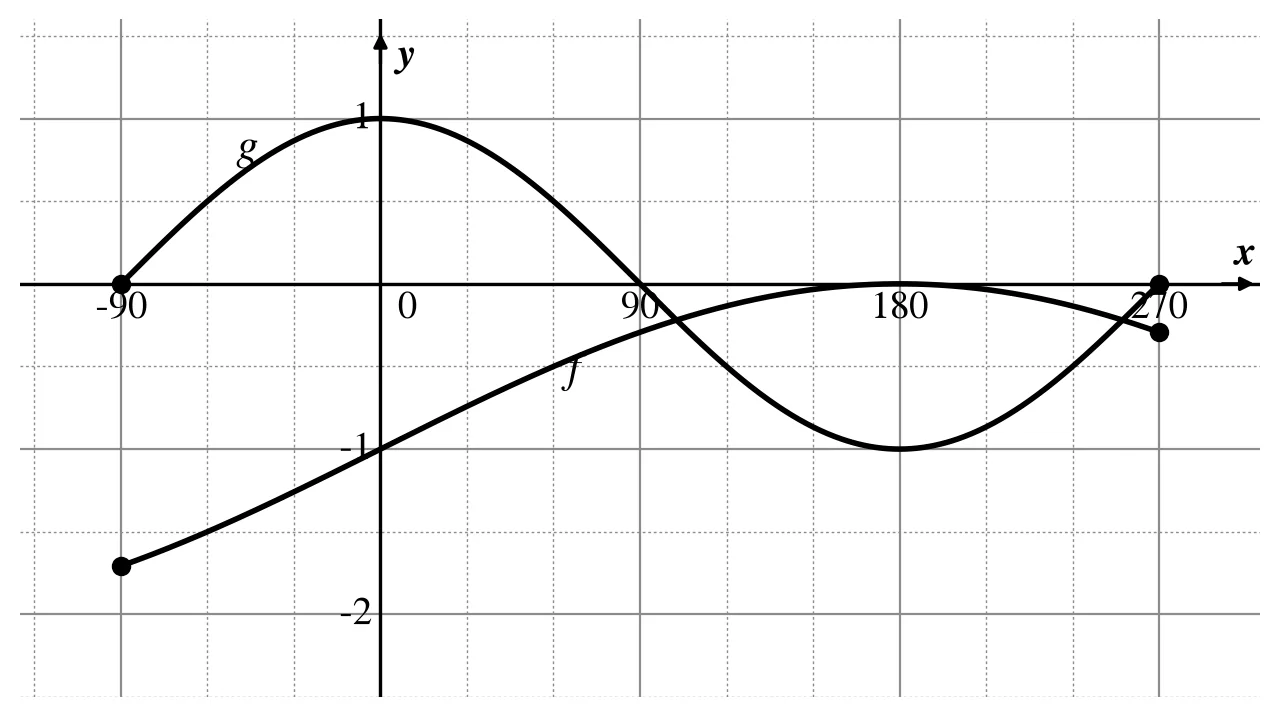 5.4 Write down the value(s) of where (1)
Show the memo (1 tick)Memo
- ✓Answer
1 mark · Plot and read points
- ✓
10. Question 6.5.1 · November 2024 · Paper 2 · Provincial · 1 mark
The graph of in the interval of has been drawn in the diagram below.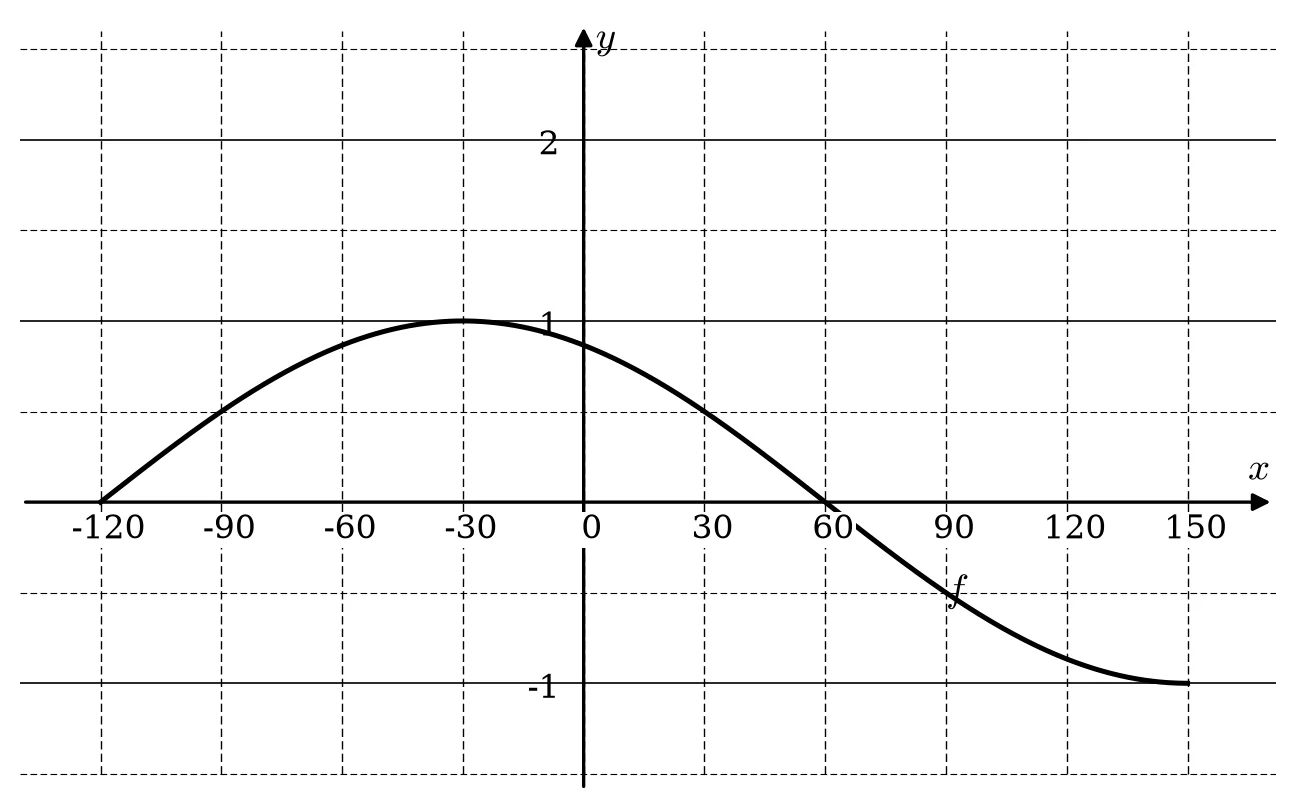 6.5 Use the graph to answer the following questions in the interval .
For which values of is:6.5.1 having a minimum value?(1)Show the memo (1 tick)Memo
- ✓Answer
1 mark · Plot and read points
- ✓
Graphs Grade 10 videos
Short lessons from South African teachers first. Videos load only when you tap play, to save your data.
Free on Android
Know exactly which skill is costing you marks.
Mark past papers tick by tick in the NavyBlue app. It remembers every mark you lose, shows you the skills to fix first, and picks your next questions.
Get NavyBlue free on Google Play
