Grade 12 Maths · Calculus · Paper 1
Graph Interpretation Grade 12
Real Graph Interpretation past paper questions and answers from 2023 to 2025, with each memo split into the ticks examiners give. Try one, mark yourself, and see exactly which skill cost you marks.
- past paper questions
- 32 past paper questions
- skills
- 10 skills
- videos
- 10 videos
Try a Graph Interpretation exam question
No sign-up. Takes 3 minutes.
Question 5.2 · May/June 2025 · Paper 1 · National (DBE) · 2 marks
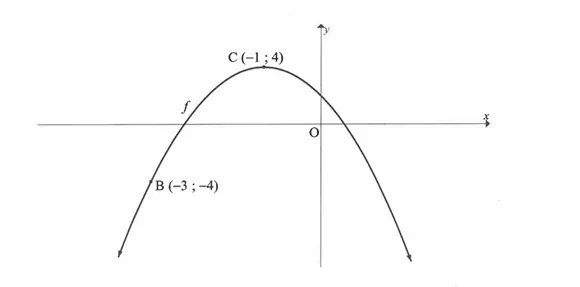
Work it out on paper first. Then mark yourself with the official memo, one tick at a time.
Graph Interpretation skills
Each skill is one thing a memo gives a tick for. Tap one for its own questions, notes and videos.
- Find a horizontal or vertical lengthFind a vertical or horizontal distance as top minus bottom or right minus left (for example the vertical gap between f and g is f(x) − g(x)).17 past paper questions · 3 videos
- Shift a graphSlide a graph left, right, up or down and write its new equation (for example moving y = x² two units right gives y = (x − 2)²).14 past paper questions · 3 videos
- Find the equation of a graphWork out the equation of a graph by choosing its general form and using given points or features to find the missing numbers.5 past paper questions · 3 videos
- Find where two graphs intersectFind where two graphs meet by setting their equations equal and solving (for example x² = x + 2 gives the points (2; 4) and (−1; 1)).15 past paper questions · 3 videos
- Solve an inequality from a graphUse a graph to find the x-values where it is above or below the x-axis or another graph (for example where f(x) > 0).26 past paper questions · 3 videos
- State increasing and decreasing intervalsGive the x-values where a graph is going up or going down (for example y = x² is decreasing for x < 0 and increasing for x > 0).5 past paper questions · 3 videos
- Find k for number of rootsUse the turning points of a graph to find the values of k for which a line y = k cuts it a given number of times.5 past paper questions · 4 videos
- Solve product inequality from graphsUse two graphs to find where f(x) × g(x) or f(x) ÷ g(x) is positive or negative by comparing their signs on each interval.12 past paper questions · 3 videos
- Find stationary pointsFind the turning points of a curve by setting the derivative equal to 0 and solving, then say which are maximums and which are minimums.11 past paper questions · 3 videos
- Interpret a derivative graphUse the graph of f′ to describe f, like where f has turning points (where f′ = 0) and where f is increasing (where f′ > 0).5 past paper questions · 3 videos
More Graph Interpretation Grade 12 questions and answers
Try each one on paper before you open the memo.
4. Question 7.4.1 · May/June 2025 · Paper 2 · National (DBE) · 2 marks
In the diagram, the graphs of and are drawn for the interval .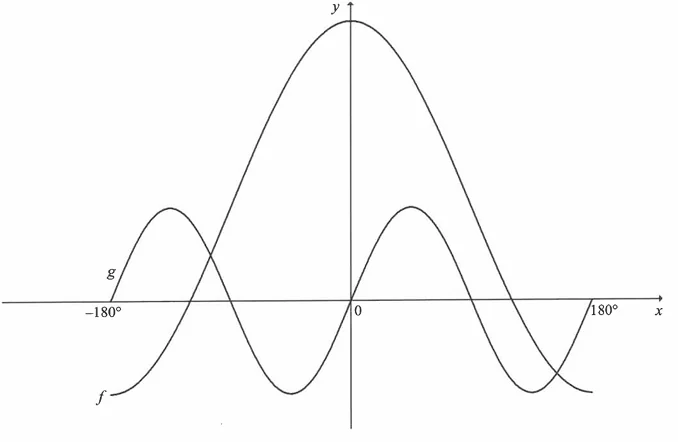 7.4 Use the graphs to determine the values of x, in the interval for which:7.4.1 (2)
Show the memo (2 ticks)Memo
- ✓Analyze the conditions for the product to be negativeFor , the signs of and must be different (+ and - OR - and +).
represents the gradient of . It is positive when is increasing () and negative when is decreasing ().
Condition 1: and
is positive for .
is negative for .
Intersection:
Condition 2: and
is negative for .
is positive for .
Intersection:1 mark · Solve product inequality from graphs
- ✓State final union of intervals
OR
or1 mark · Solve product inequality from graphs
- ✓
5. Question 6.4 · May/June 2024 · Paper 1 · National (DBE) · 2 marks
The graphs of and are drawn below. D and E are the -intercepts and P is the -intercept of . The turning point of is T. The graphs of and intersect at P and E.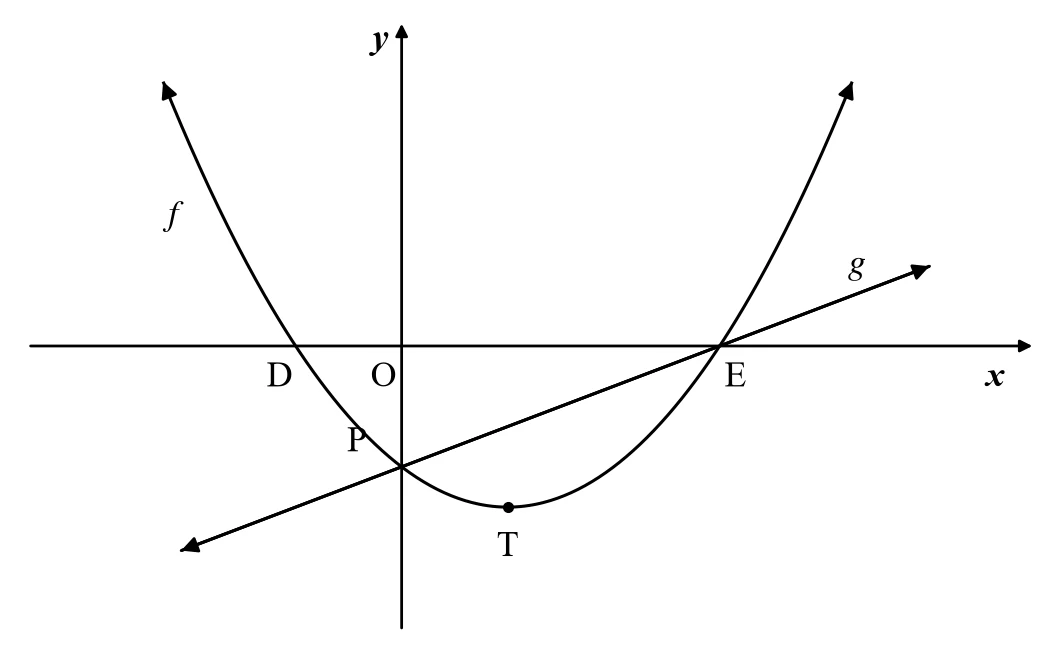 6.4 Write down the values of x for which .(2)
Show the memo (2 ticks)Memo
- ✓Identify interval left of first intersection
1 mark · Solve an inequality from a graph
- ✓Identify interval right of second intersection
1 mark · Solve an inequality from a graph
- ✓
6. Question 3.1.5(a) · March 2025 · Provincial · 2 marks
3.1 Given:
Given:3.1.5 Determine the value(s) of for which:3.1.5(a) is decreasing.(2)Show the memo (2 ticks)Memo
- ✓
- ✓
7. Question 6.2.2 · March 2025 · Provincial · 4 marks
6.2 In the diagram, the graphs of and are drawn for the interval .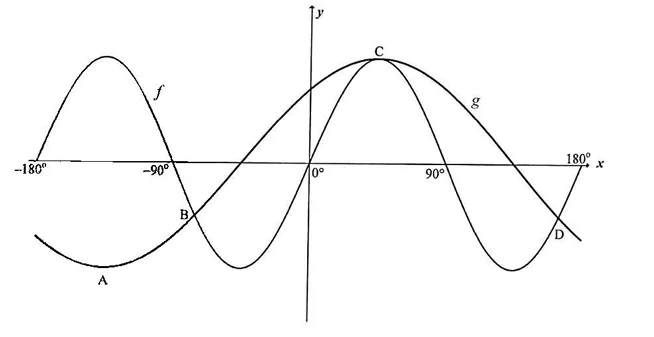 6.2.2 Write down the coordinates of A and B.(4)
Show the memo (4 ticks)Memo
- ✓A: x-coordinate has its minimum where , so
1 mark · Find trig graph amplitude and range
- ✓A: y-coordinate
1 mark · Find trig graph amplitude and range
- ✓B: x-coordinateFrom 6.1: . For B (), :
1 mark · Find solutions in an interval
- ✓B: y-coordinate
1 mark · Find solutions in an interval
- ✓
8. Question 4.4 · March 2024 · Paper 1 · Provincial · 5 marks
The sketch below shows the graphs of and . is the -intercept, and the -intercept of . is the -intercept of . is the -intercept of . is the turning point of . is a point on , such that is parallel to the -axis. is 2 units and is 7 units.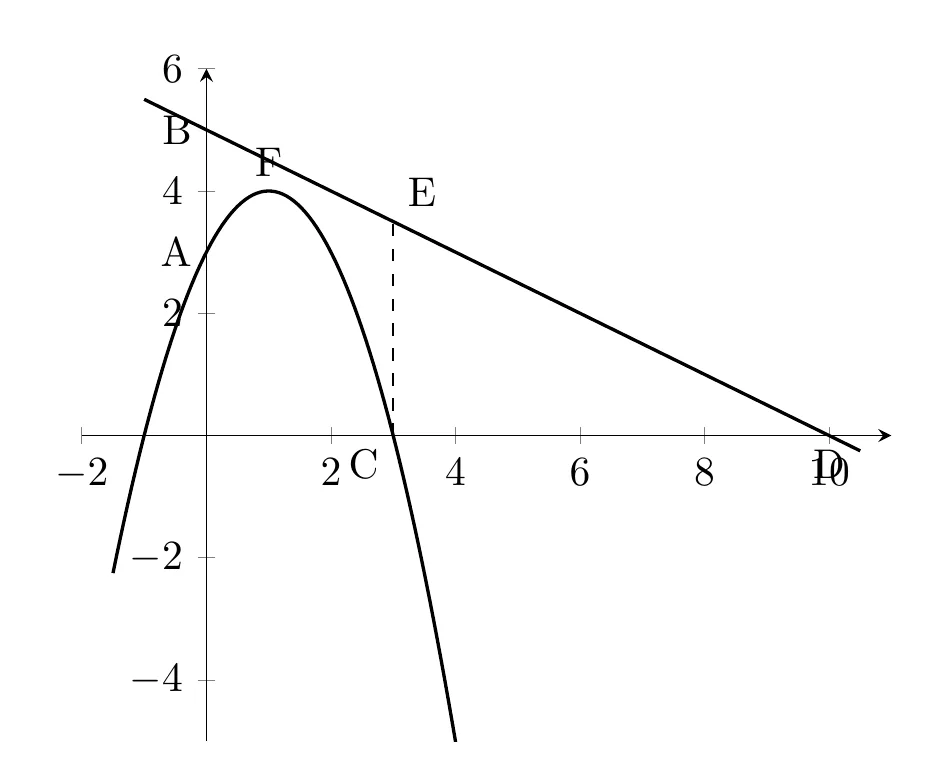 4.4 Determine the length of .(5)
Show the memo (4 ticks)Memo
- ✓Determine coordinates of and
1 mark · Find a horizontal or vertical length
- ✓Calculate gradient of line and
2 marks · Calculate gradient between two points
- ✓Find -coordinate of Equation of :
Since -axis,1 mark · Substitute into a formula
- ✓Calculate length units
1 mark · Find a horizontal or vertical length
- ✓
9. Question 8.4 · March 2024 · Paper 1 · Provincial · 2 marks
In the diagram below, the graphs of and are drawn on the same set of axes for . is an -intercept of and has coordinates . is a turning point of and has coordinates .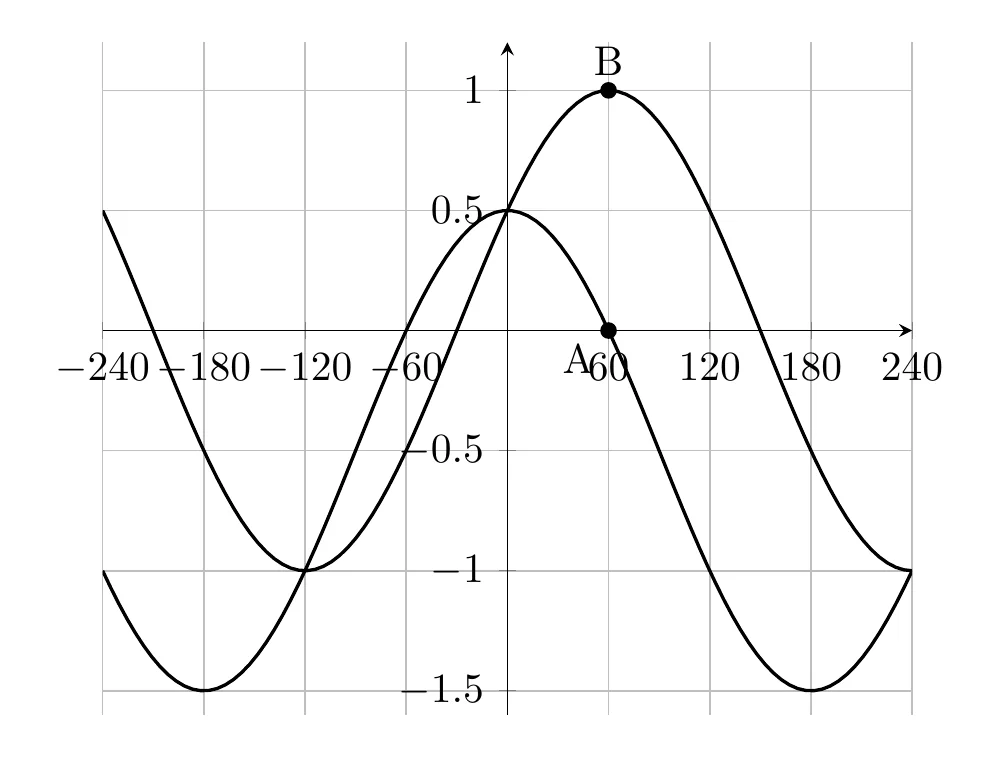 8.4 For which values of will in the interval ?(2)
Show the memo (1 tick)Memo
- ✓Analyze signs of both graphs
2 marks · Solve product inequality from graphs
- ✓
10. Question 4.1 · March 2023 · Provincial · 4 marks
Given: and4.1 Determine the coordinates of the point(s) where the two graphs intersect.(4)Show the memo (4 ticks)Memo
- ✓Equate functions
1 mark · Find where two graphs intersect
- ✓Factors
1 mark · Factorise a trinomial
- ✓x-values or
1 mark · Solve a quadratic by factorising
- ✓y-values;
and1 mark · Find where two graphs intersect
- ✓
Graph Interpretation Grade 12 videos
Short lessons from South African teachers first. Videos load only when you tap play, to save your data.
Free on Android
Know exactly which skill is costing you marks.
Mark past papers tick by tick in the NavyBlue app. It remembers every mark you lose, shows you the skills to fix first, and picks your next questions.
Get NavyBlue free on Google Play
